Tea Houses Demo
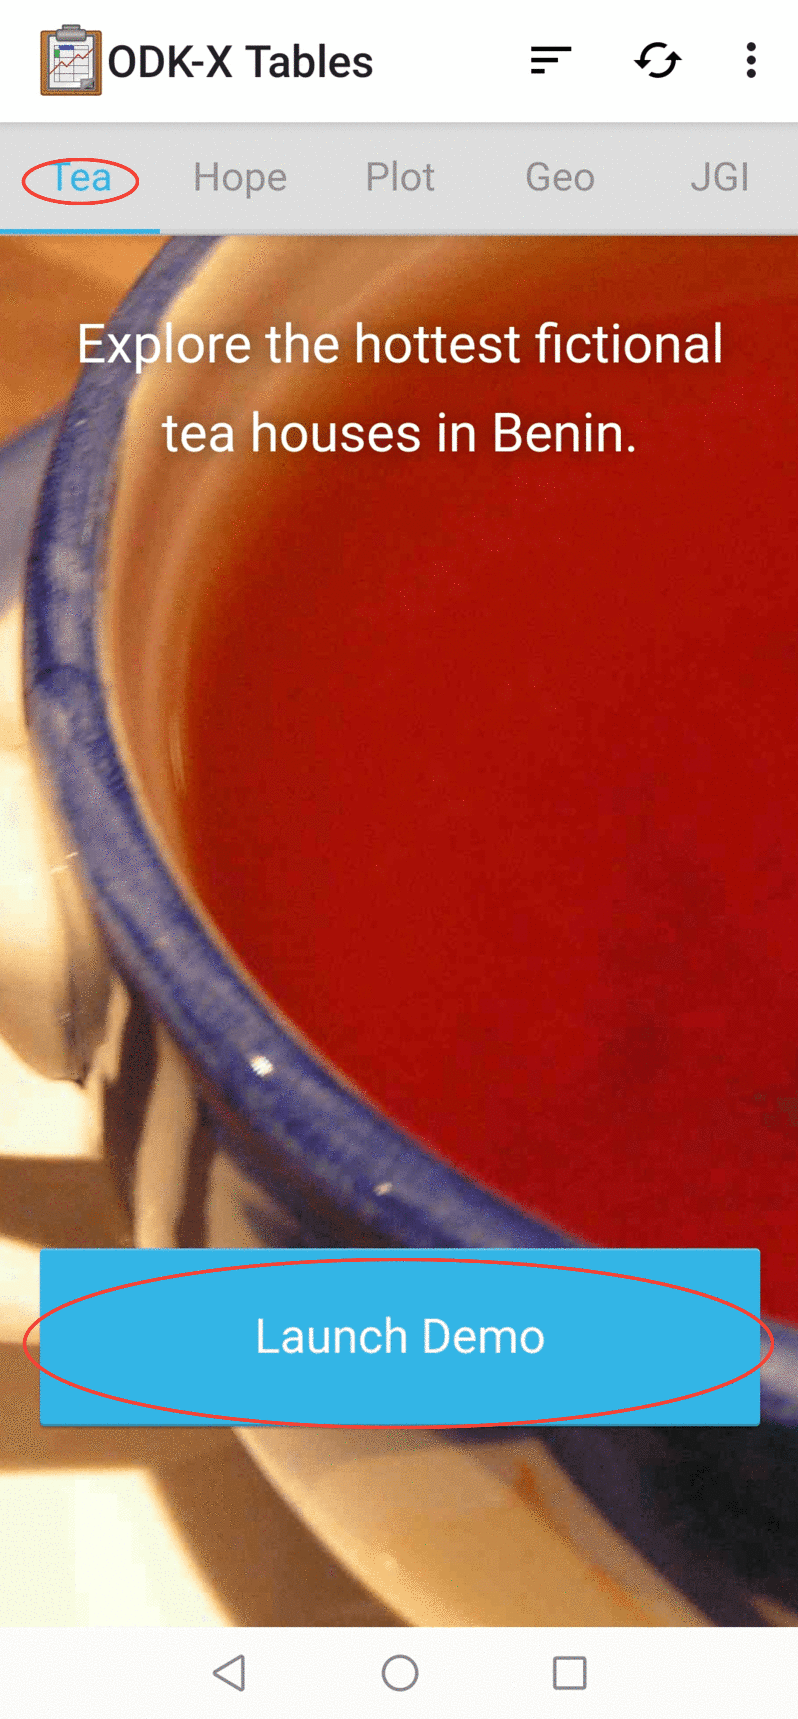
For this portion of the tutorial, we will explore the Tea Houses demo. Select the tab labeled Tea and press Launch Demo.
The Tea Houses demo is a fictional collection of Tea Houses in Benin and the teas they offer.
Custom View
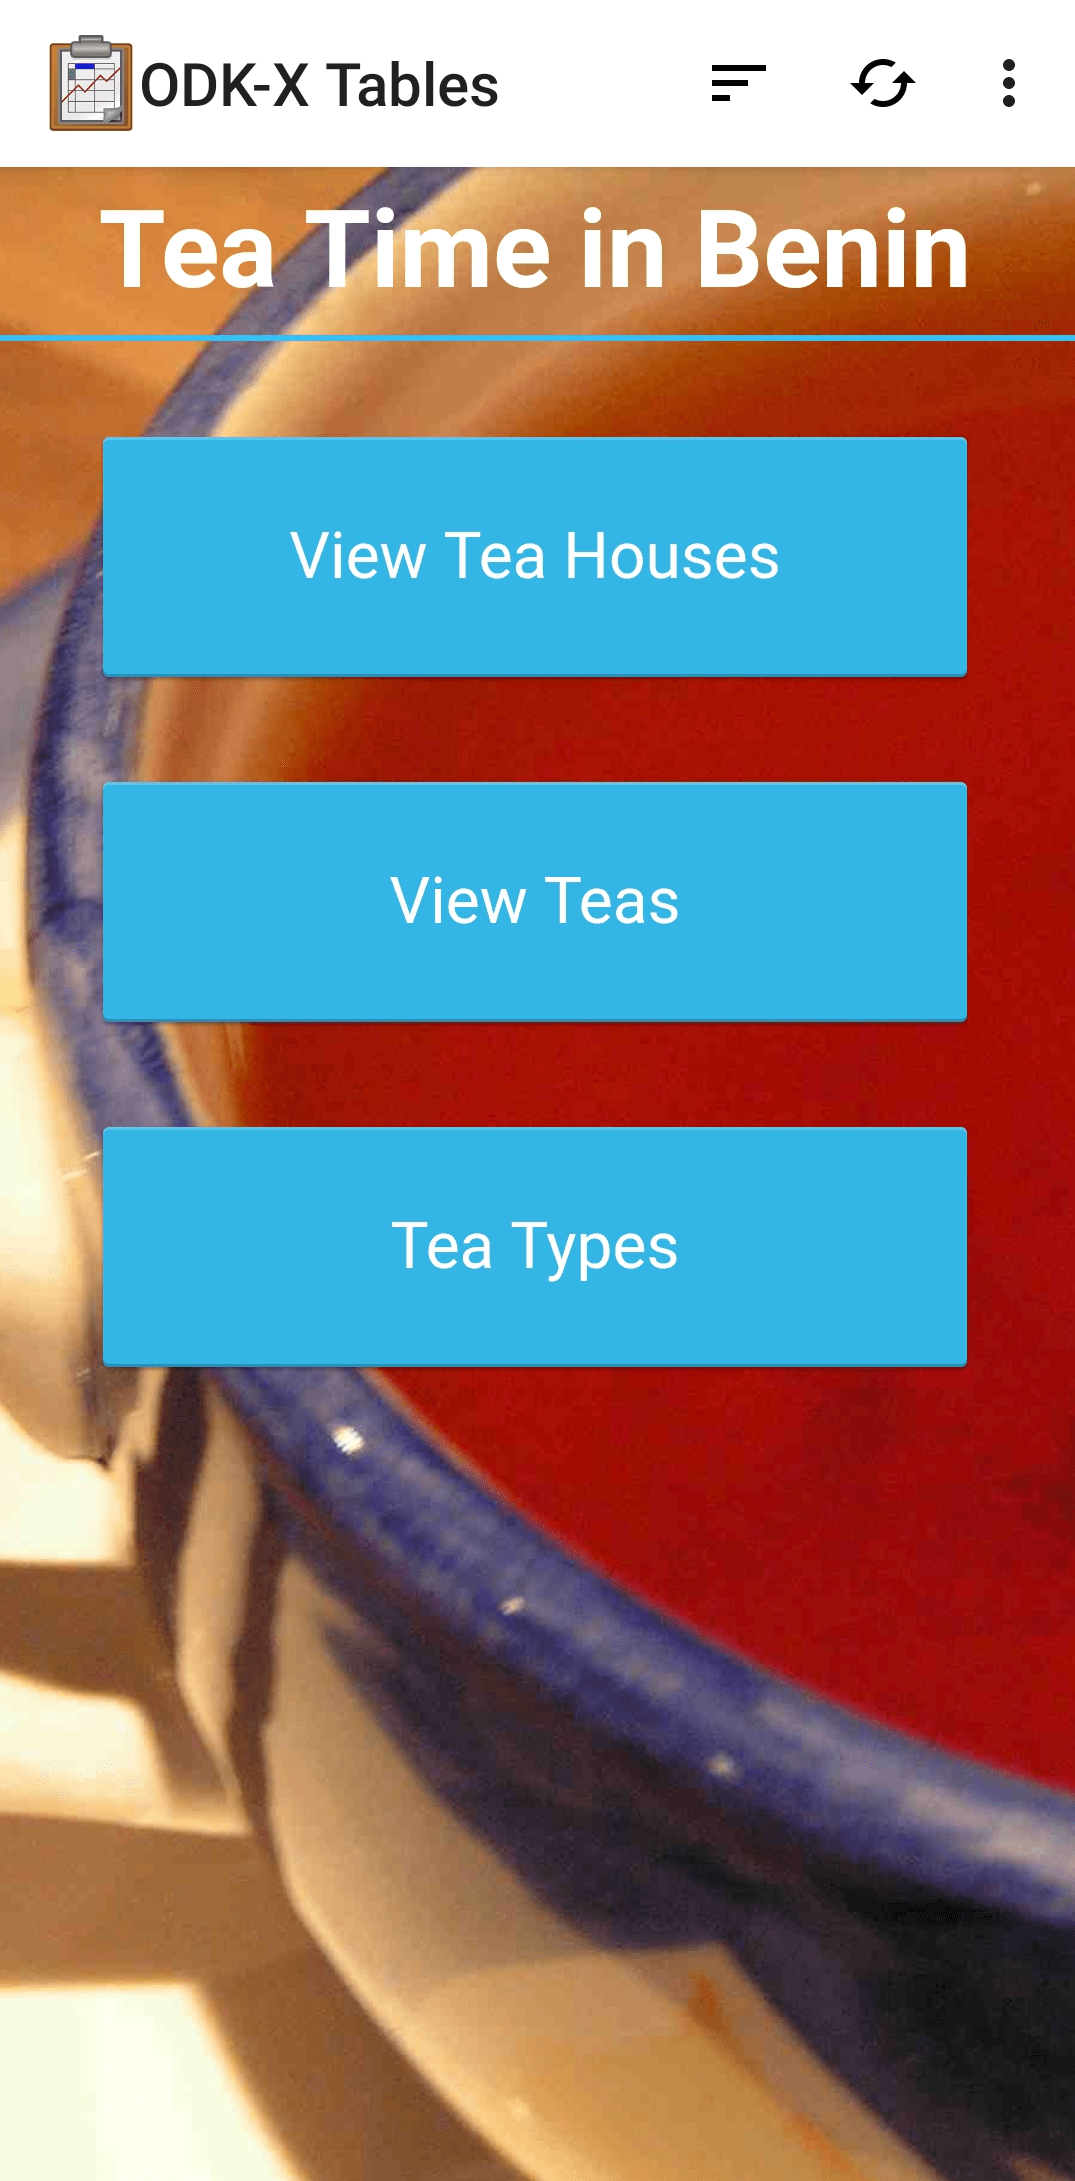
The first screen you will see after launching the Tea Houses demo is a custom view.
As with the custom home screen, this custom view is rendered entirely in HTML, CSS, and JavaScript defined within the Tea Houses demo. It does not collect or present data, it acts as a navigation screen to allow the user to choose which of the three data set to interact with.
Custom views are not limited to navigation and workflow interfaces. They can also be used to view data, create data visualizations, and modify data in the database. The Plot Demo and JGI Demo explore this more fully.
Press the button labeled to launch the List View of the available teas.
Learn More
For more information about custom views, view the Custom View guide.
List View
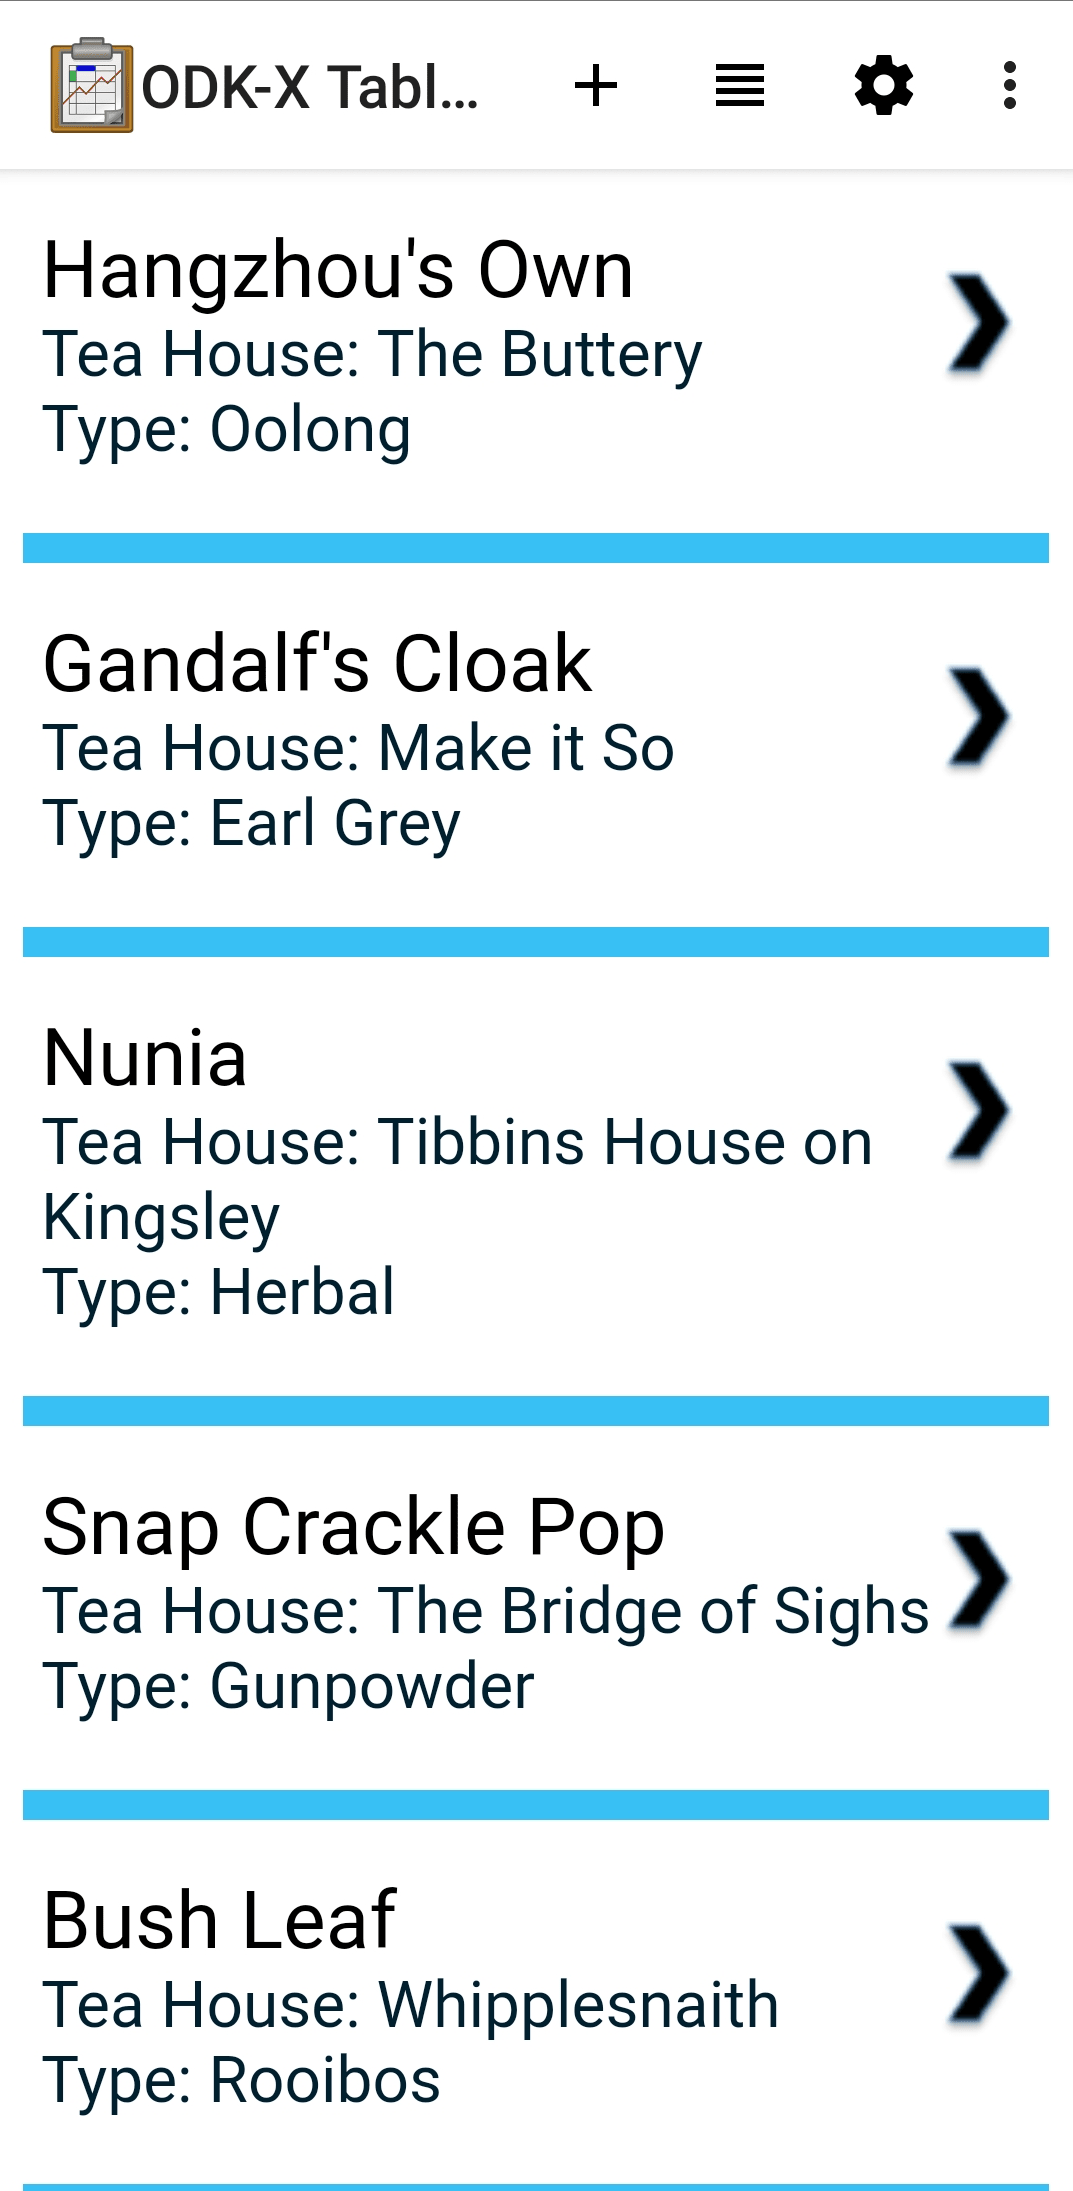
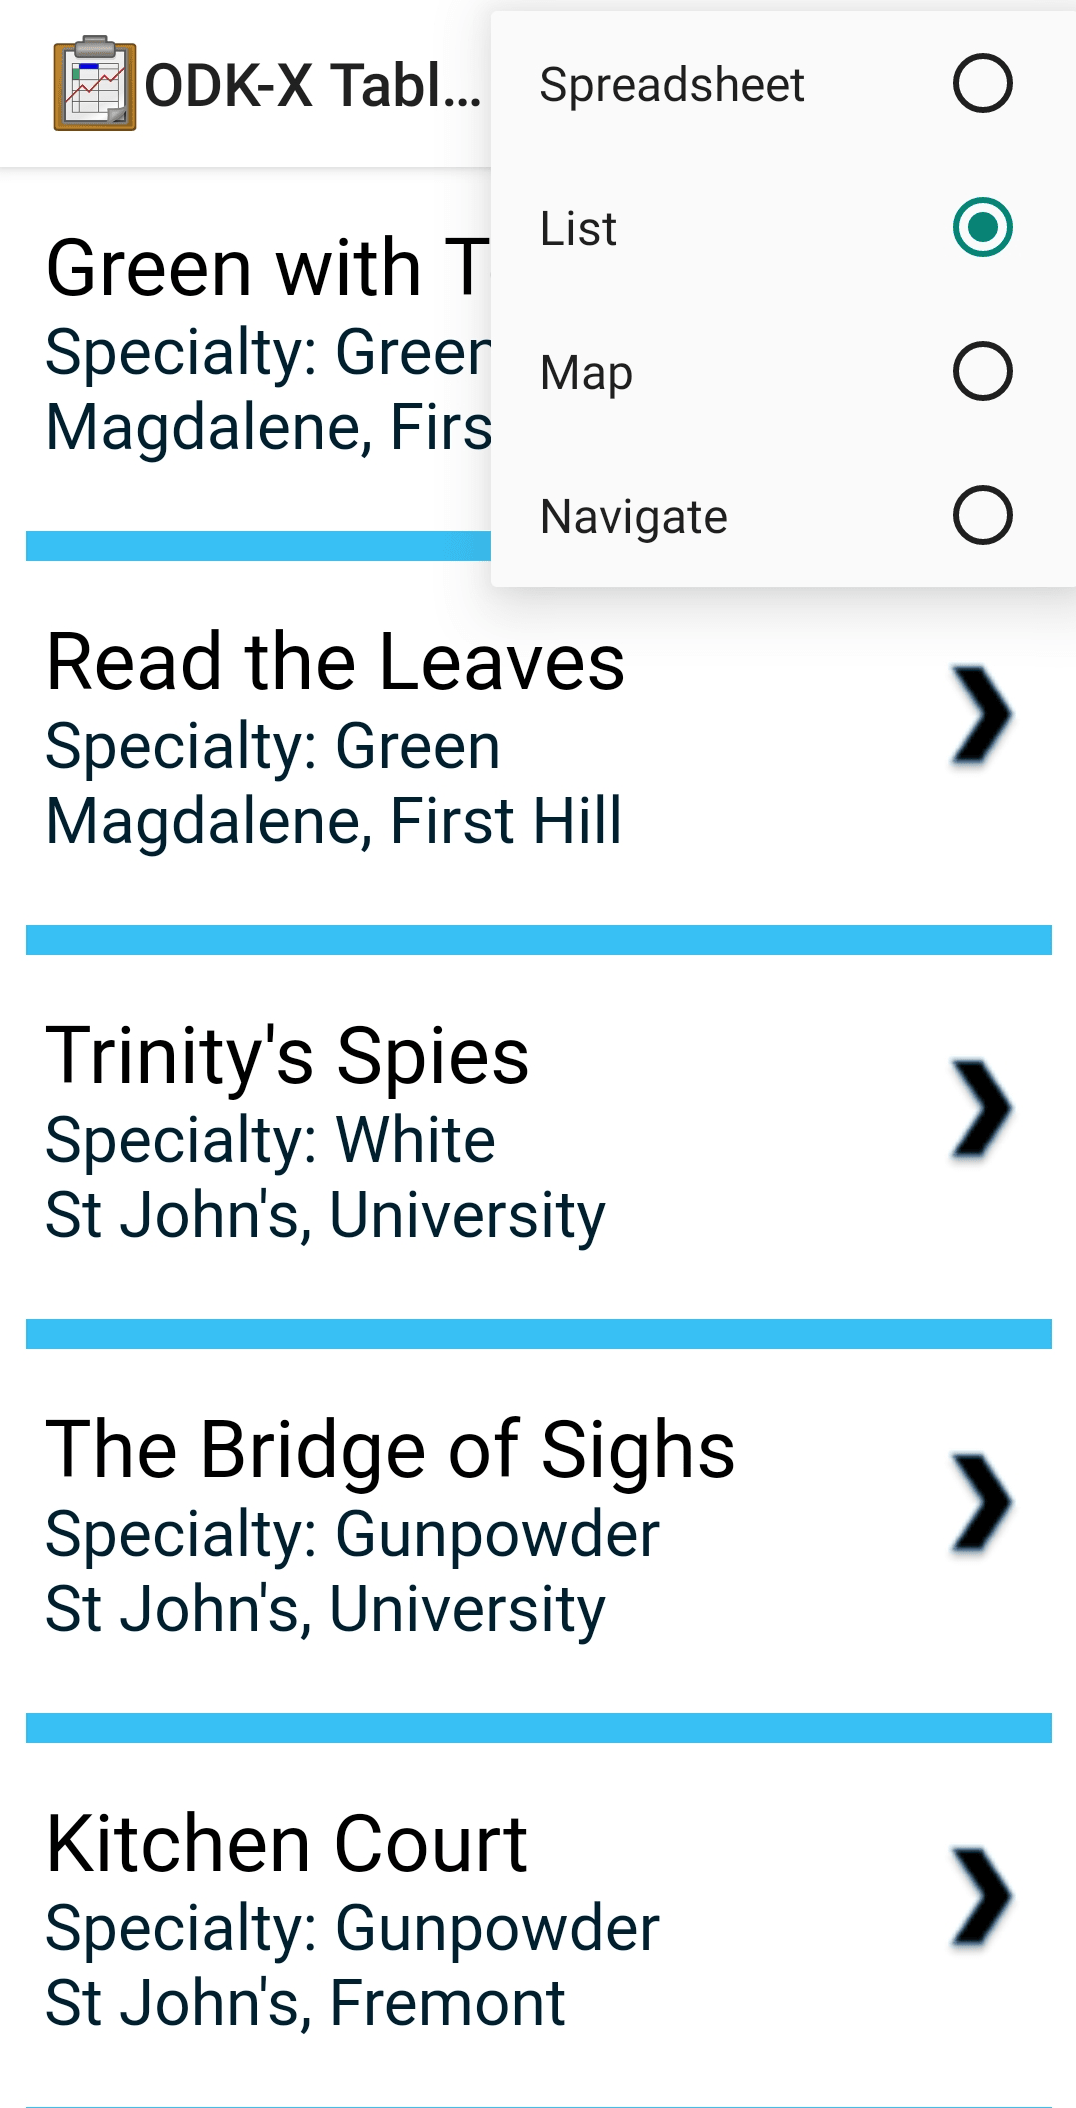
This screen shows a list of all teas available in the Tea Inventory data table. This view is customized with HTML, CSS, and JavaScript. It provides a simple way to view and navigate collected data. As new teas are added to the inventory, this list view will grow.
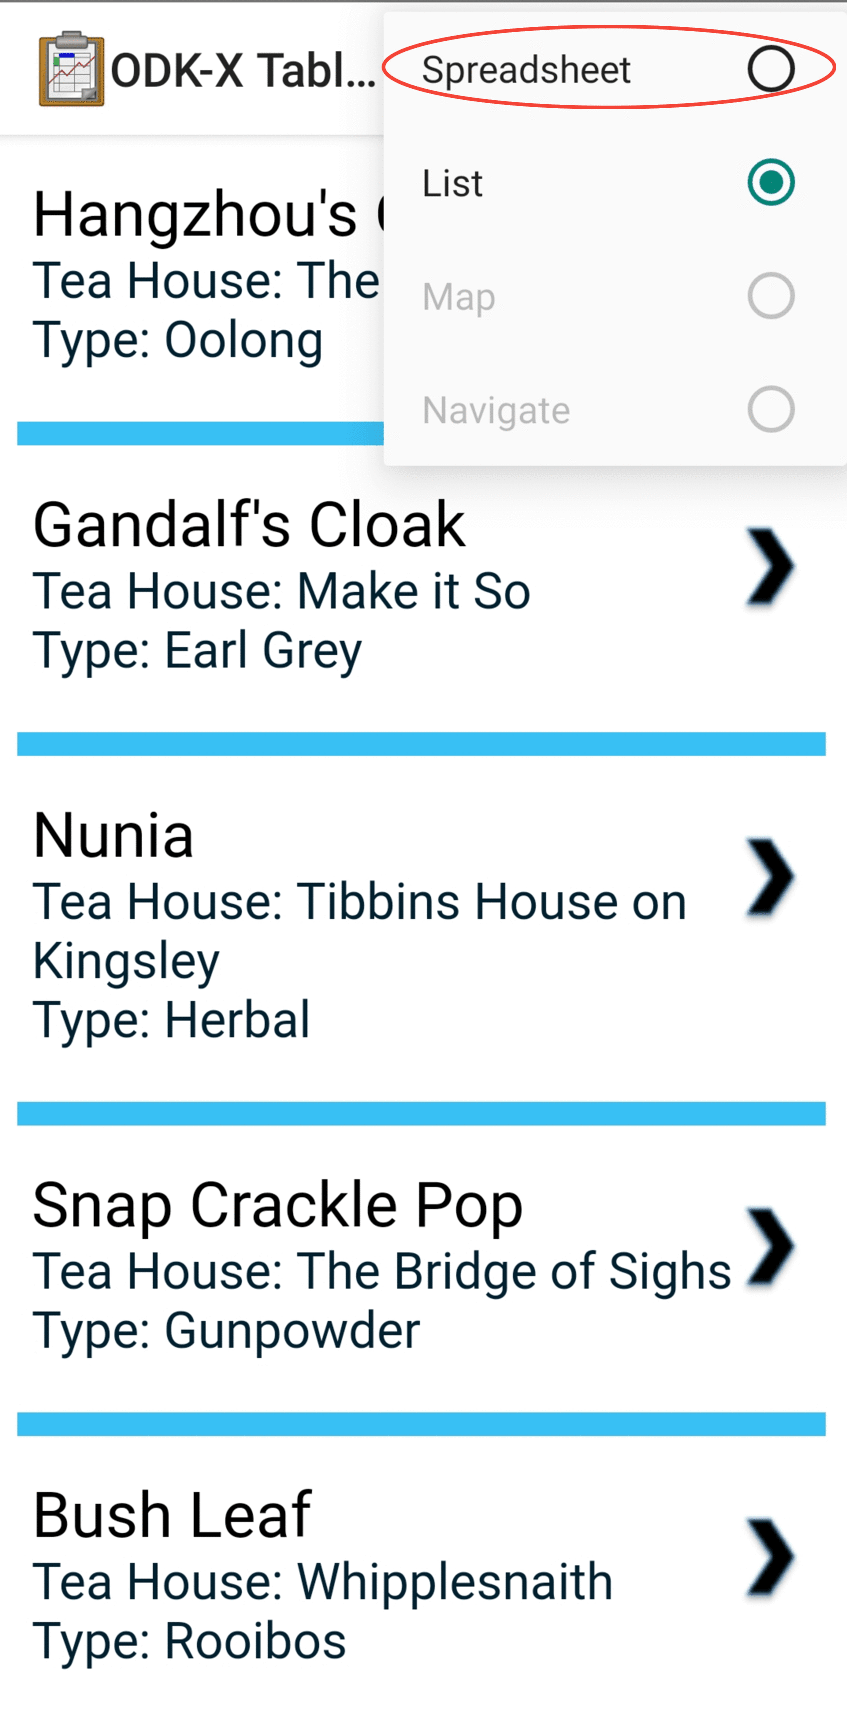
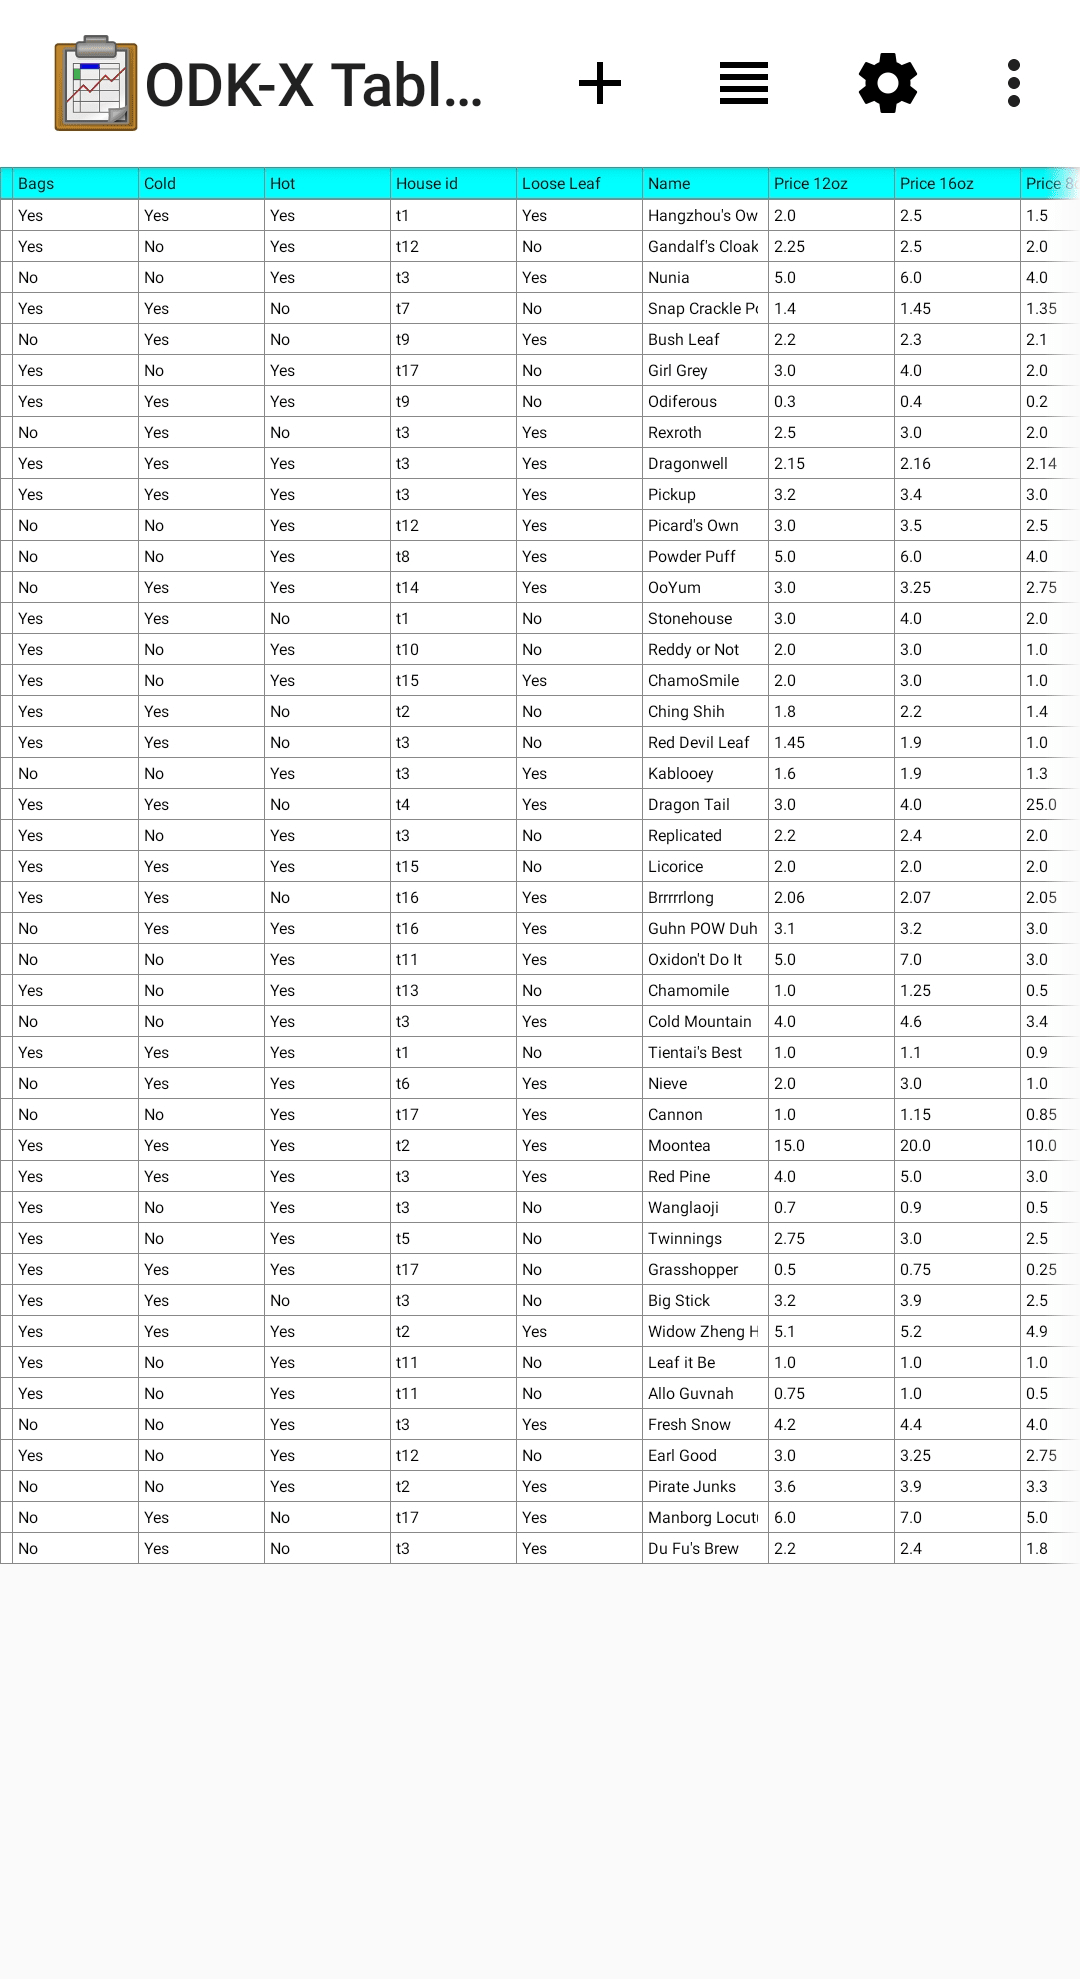
To see the raw data, we will switch to Spreadsheet View. Tap on the lined paper icon at the top of the screen. Here you’ll see all the possible view types. Select .
Learn More
For more information about List Views, view the List View guide.
Spreadsheet View
This view renders a full data table from the database, including all rows and columns. Unlike the views we have seen so far, this view is NOT customized via HTML, CSS, and JavaScript. This view is provided by the ODK-X platform for convenience in viewing and editing your data directly. It is meant to be a familiar view as if you were looking at it on a spreadsheet program, such as Excel. Each row here represents a tea, and each was a row in the List View.
Return to the List View by using the lined paper icon as before and selecting . Tap the tea to launch a Detail View for that tea.
Learn More
For more information about Spreadsheet View, view the Spreadsheet View guide.
Detail View
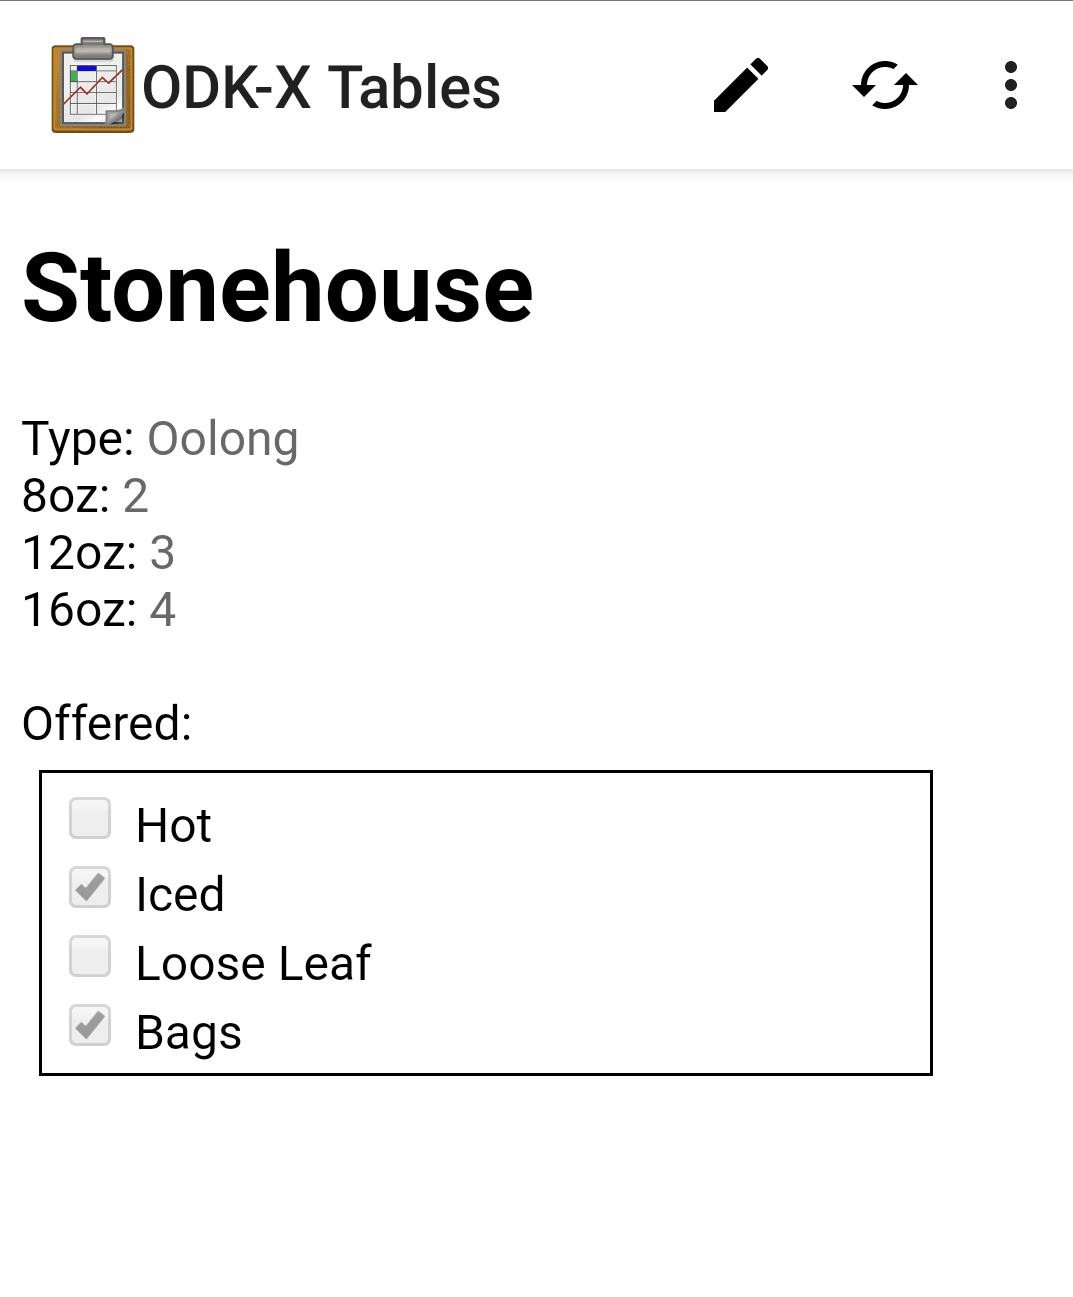
This screen shows all the details of the Stonehouse tea entry in the Tea Inventory table. The Tea Inventory table's Detail View displays information about the tea, including whether it is available hot, iced, in bags, or loose leaf. Note that the tea type is being pulled from the Tea Types table, but the JavaScript is getting the information from that table to construct our view. Like the other views, we programmed this using rudimentary HTML and JavaScript, but it could be customized to look fancier or display additional information.
Next, we will see a combination of the detail and list view options. Back out until you hit the custom view with the three buttons. .. _tables-sample-app-detail-view-learn-more:
Learn More
For more information about Detail Views, view the Detail View guide.
Detail With Sublist View
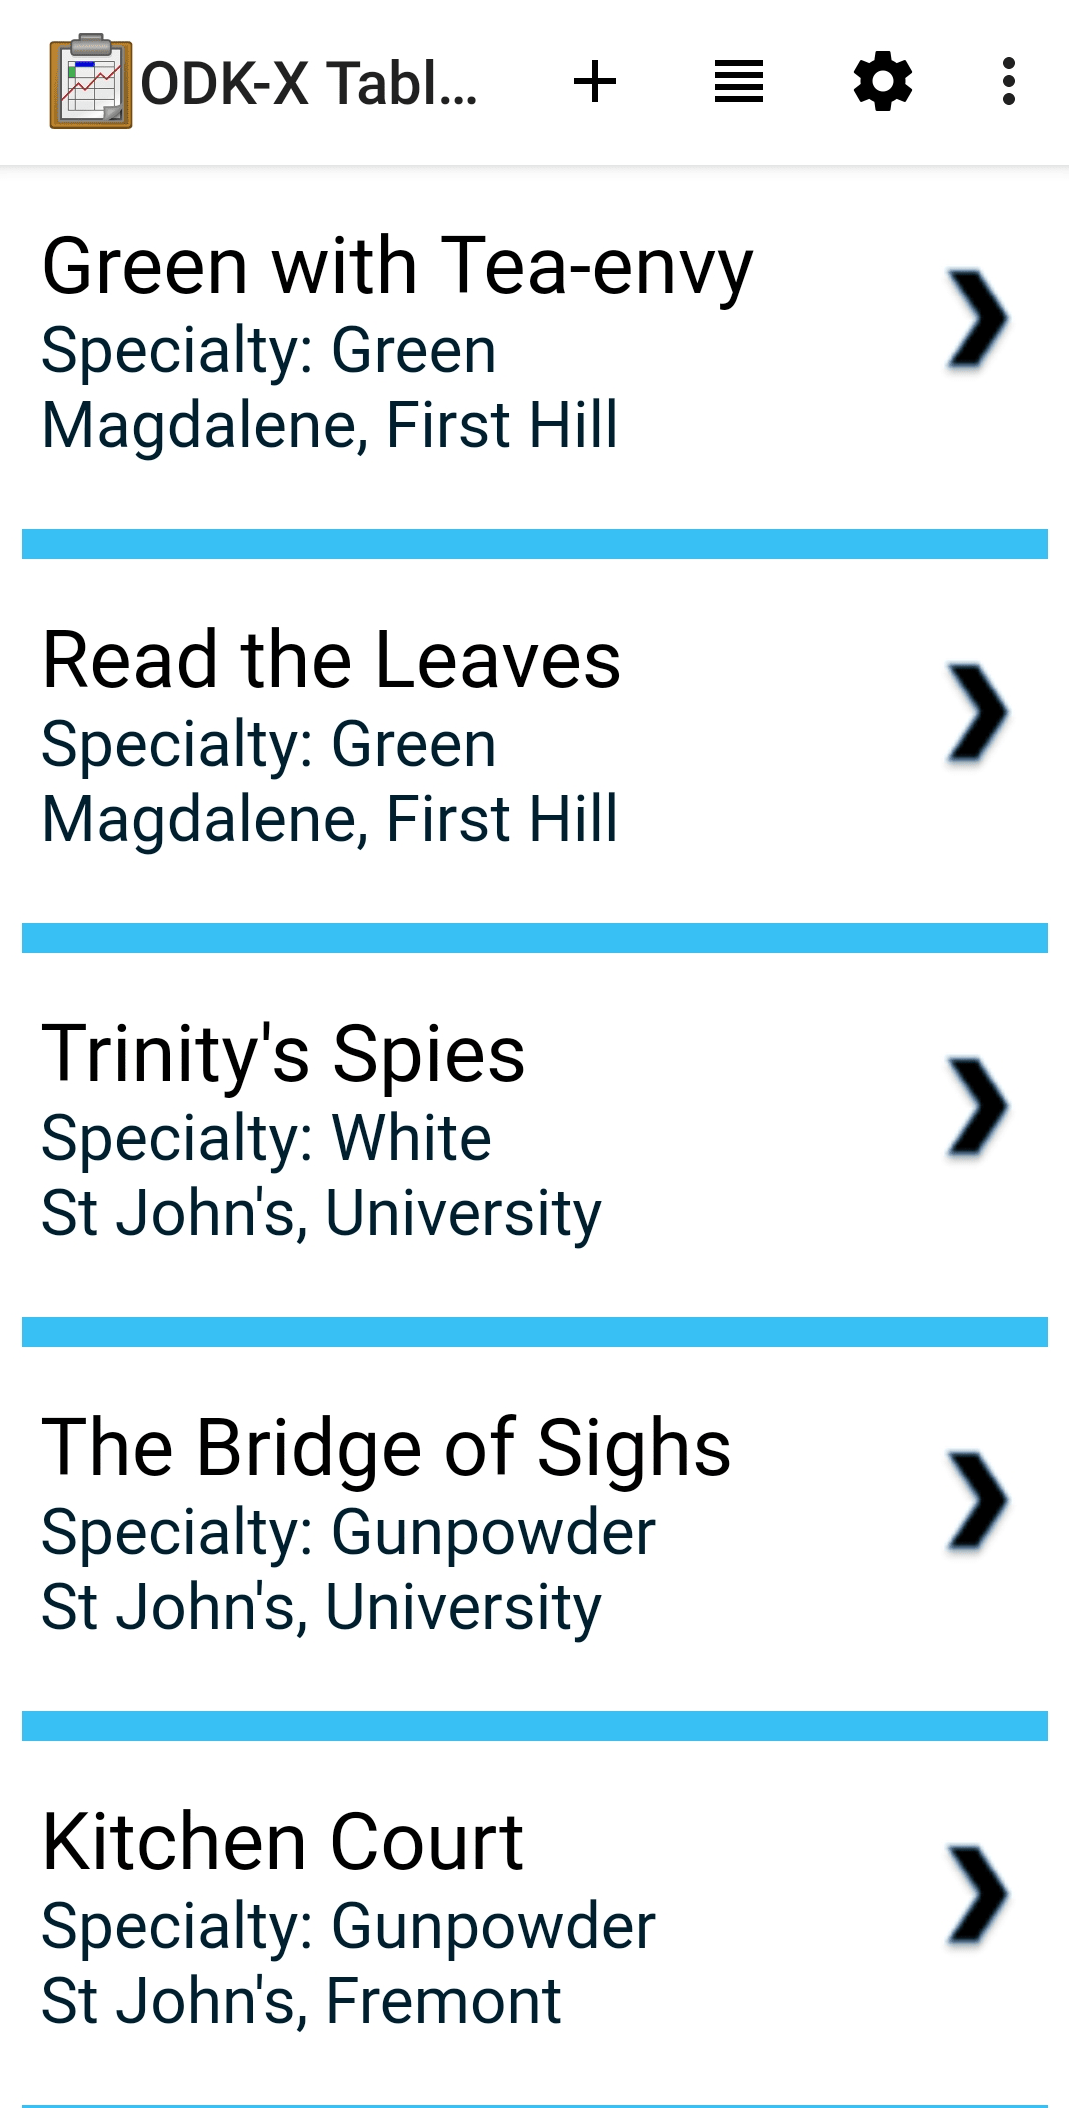
From the custom view with the three buttons, select View Tea Houses. This will launch another List View, this time showing the list of tea houses.
The Tea Houses table has been configured to use a Detail With Sublist View rather than a Detail View. Tap the Tea for All tea house to see this.
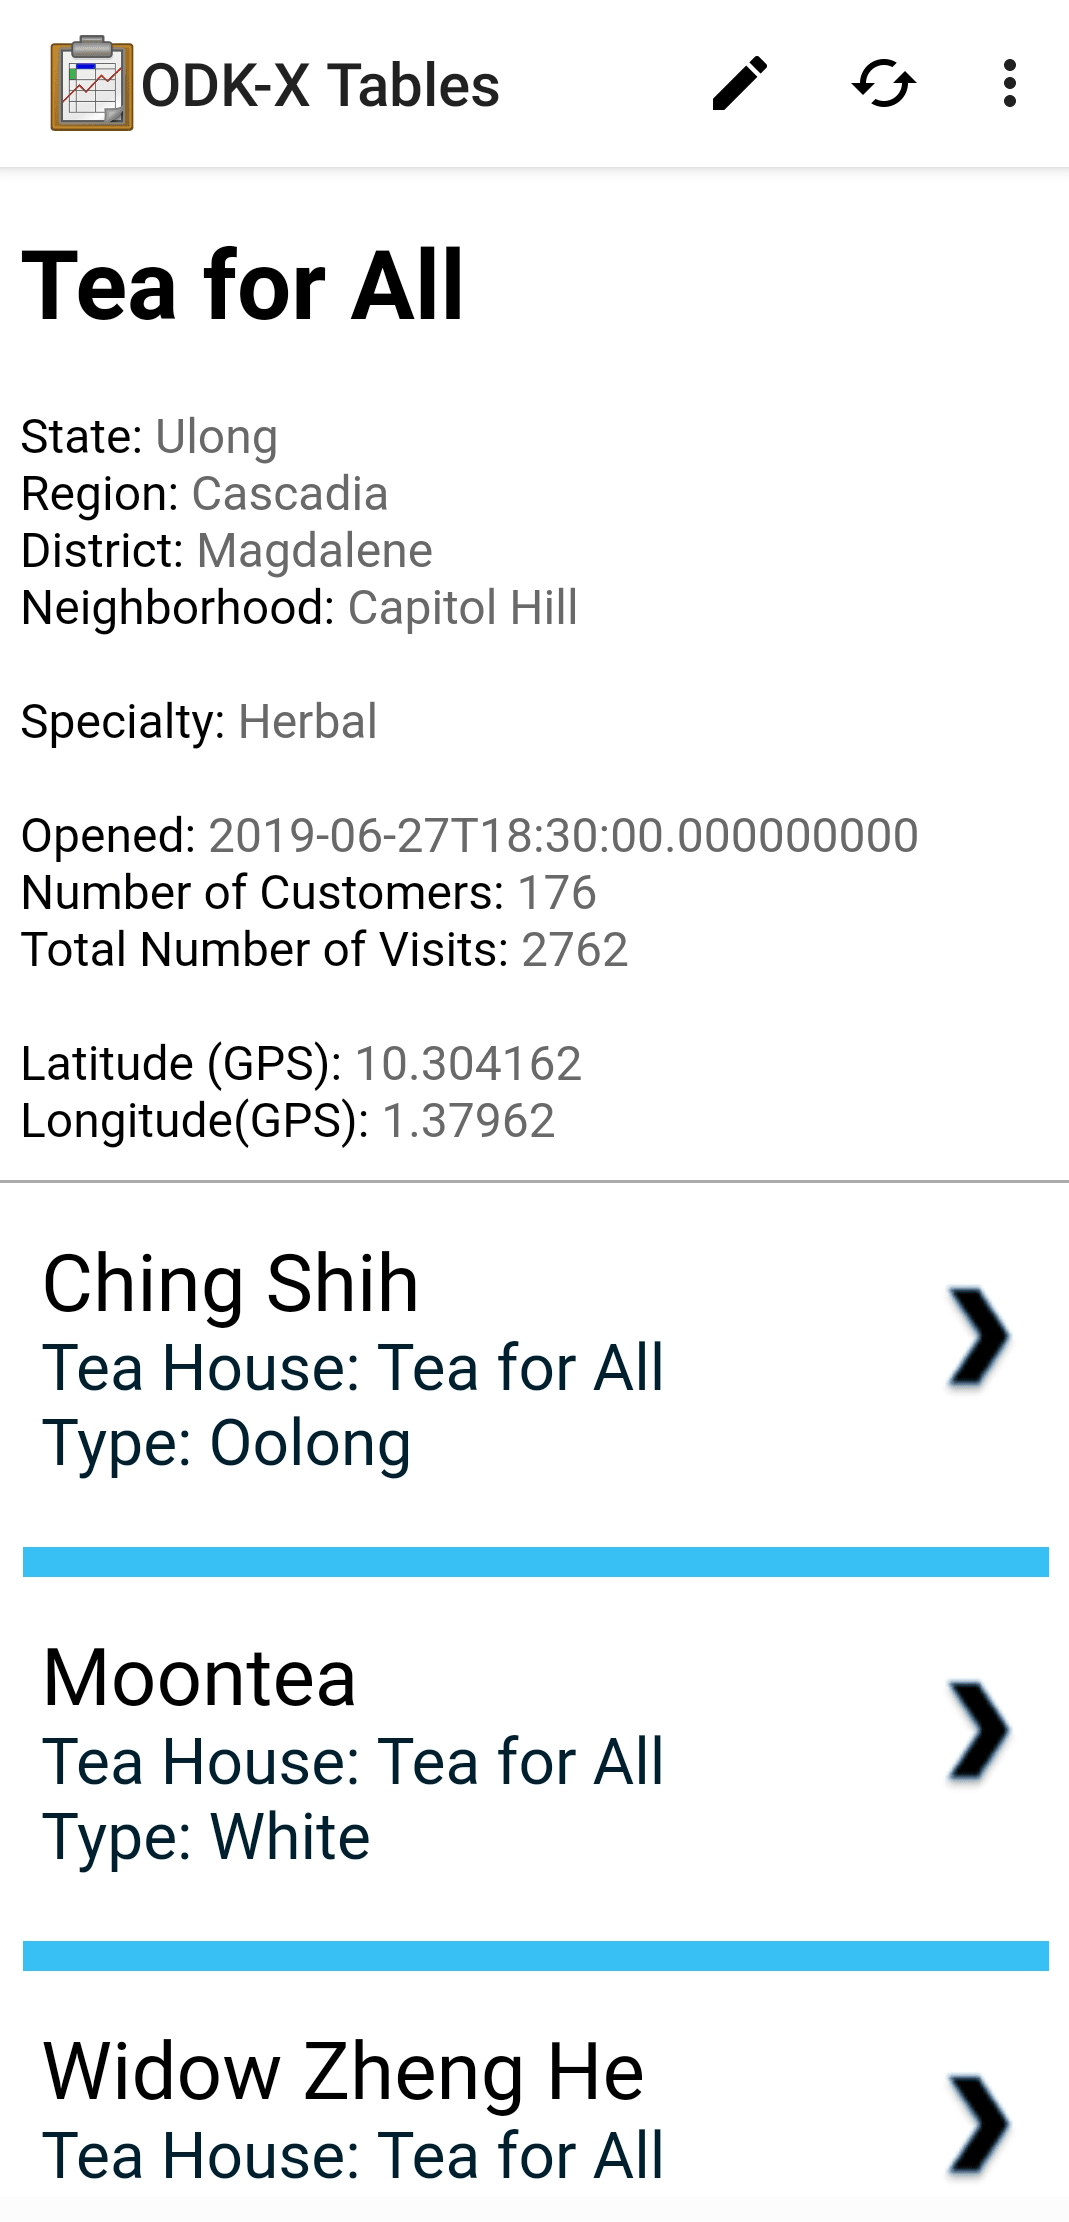
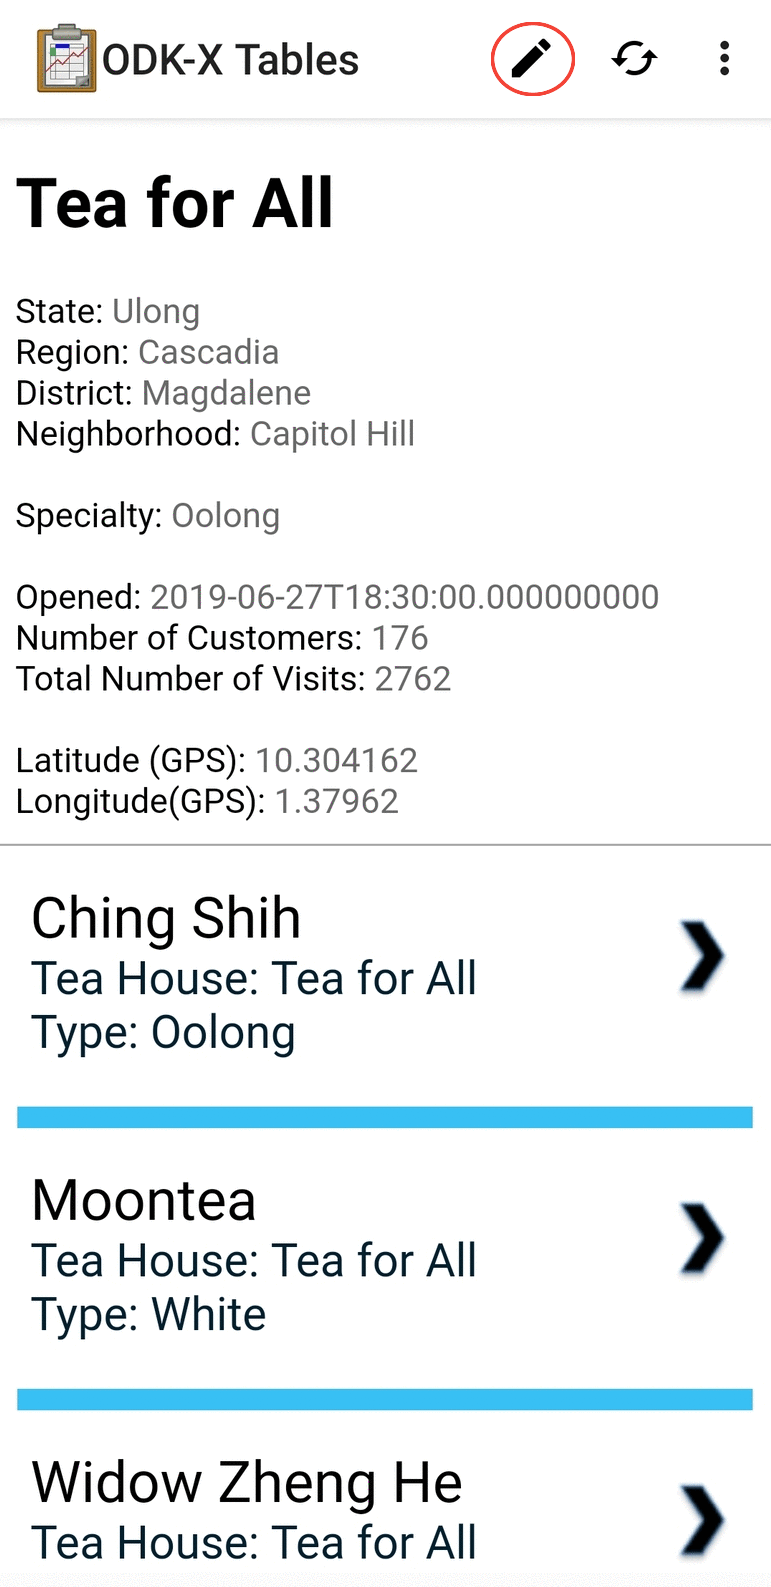
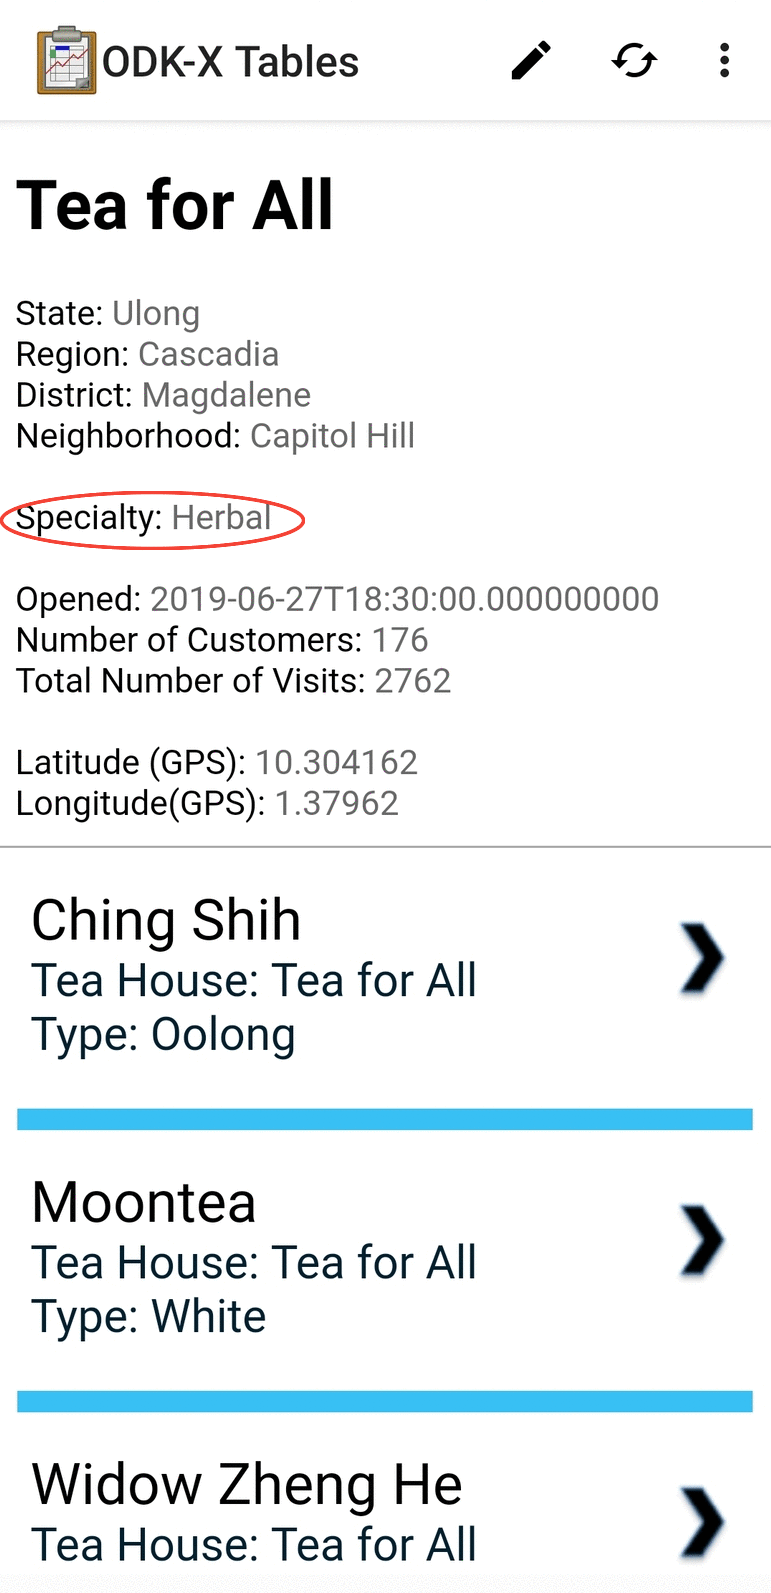
This screen contains a Detail View webpage and a subordinate List View. In this case, the Detail View displays information on the tea house, and the List View displays the teas that the tea house serves. Within the Detail View, you can scroll down to see the information we decided to display. It is also written in HTML, CSS, and JavaScript to render these table entries. The look-and-feel is similar to the Tea Inventory only because that is how we coded it. Like the List View, we programmed this using very rudimentary HTML and JavaScript, but it could be customized to look fancier or display additional information.
Scroll to the bottom of the Detail View portion of the screen and you’ll see a link as a number of teas. This is using the information in the table called Tea Inventory to tell you how many teas this tea house offers, and has also been defined in the JavaScript.
The bottom half of the screen renders the subordinate List View, which shows the list of teas available at the Tea for All teahouse. It is a separate page that is controlled by the top half.
Note
This is a simple example that has a static list. However, you could dynamically change the list that is rendered with controls in the JavaScript for the top half of the screen. For example, you could have a household detail on top, and list all family members on the bottom. You could then provide a button to change the list to only show adult family members in the list below.
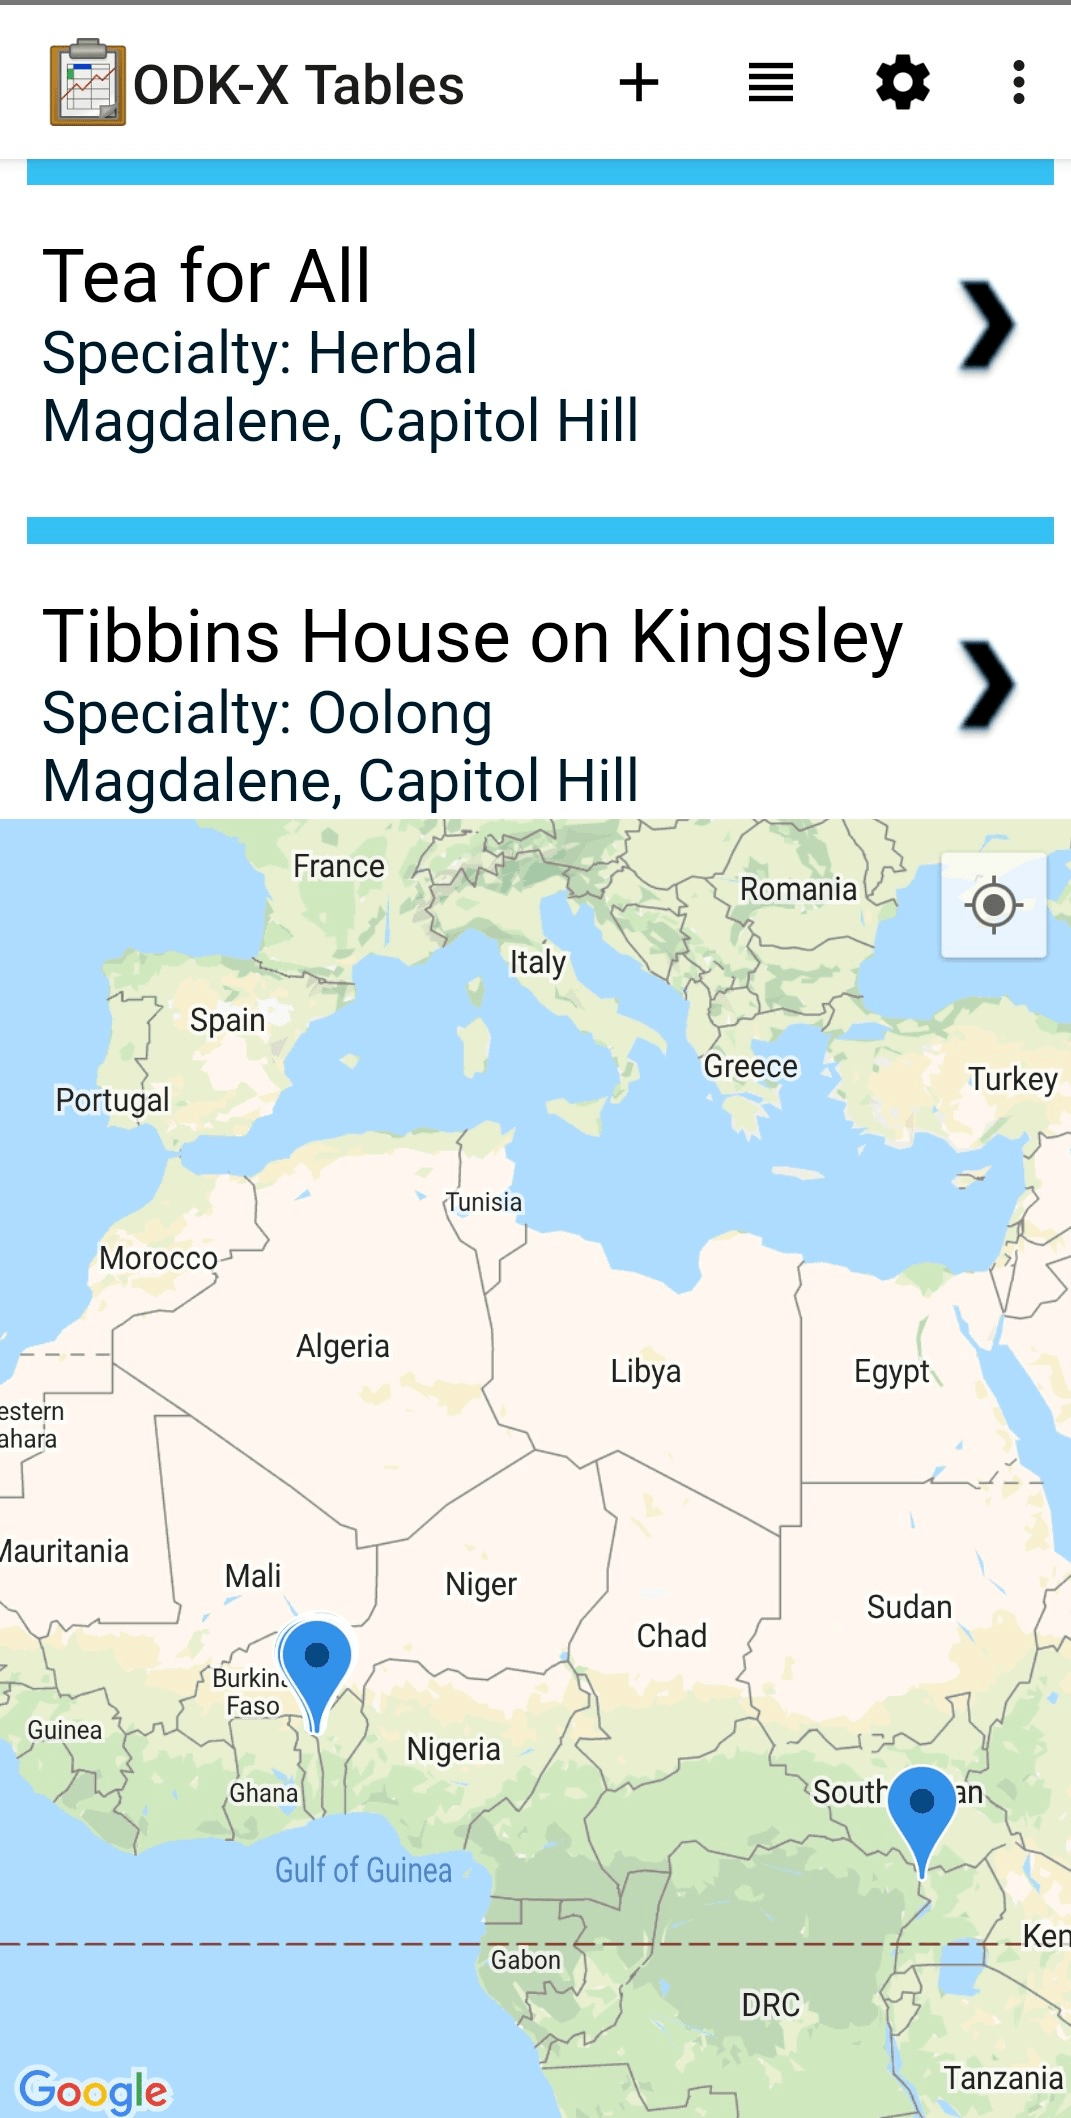
Next we will see the Map View. Back out of the Detail With Sublist View to see the list of tea houses. Press the lined paper icon and choose from the menu.
Learn More
For more information about Detail With Sublist Views, view the Detail With Sublist View guide.
Map View
All the fictional tea houses in Benin appear on the map. Pinch and squeeze or widen to zoom out and in, respectively. The tea house location is plotted based on what appeared in the Location_latitude and Location_longitude columns in the database. These can be viewed with the Spreadsheet View. When you click on a map marker, the List View will redraw with that marker's information at the top of the List View.
The List View at the top portion of the screen is rendered in custom HTML, CSS, and JavaScript, but the map portion is provided by the ODK-X platform and rendered using Google Maps.
Learn More
For more information about Map Views, view the Map View guide.
Edit Row With Survey
The final portion of the Tea Houses demo will be to edit data with Survey. Return to the List View by using the lined paper icon as before and selecting . Tap the tea house to launch a Detail With Sublist View for that tea. Tap the pencil icon in the upper right.
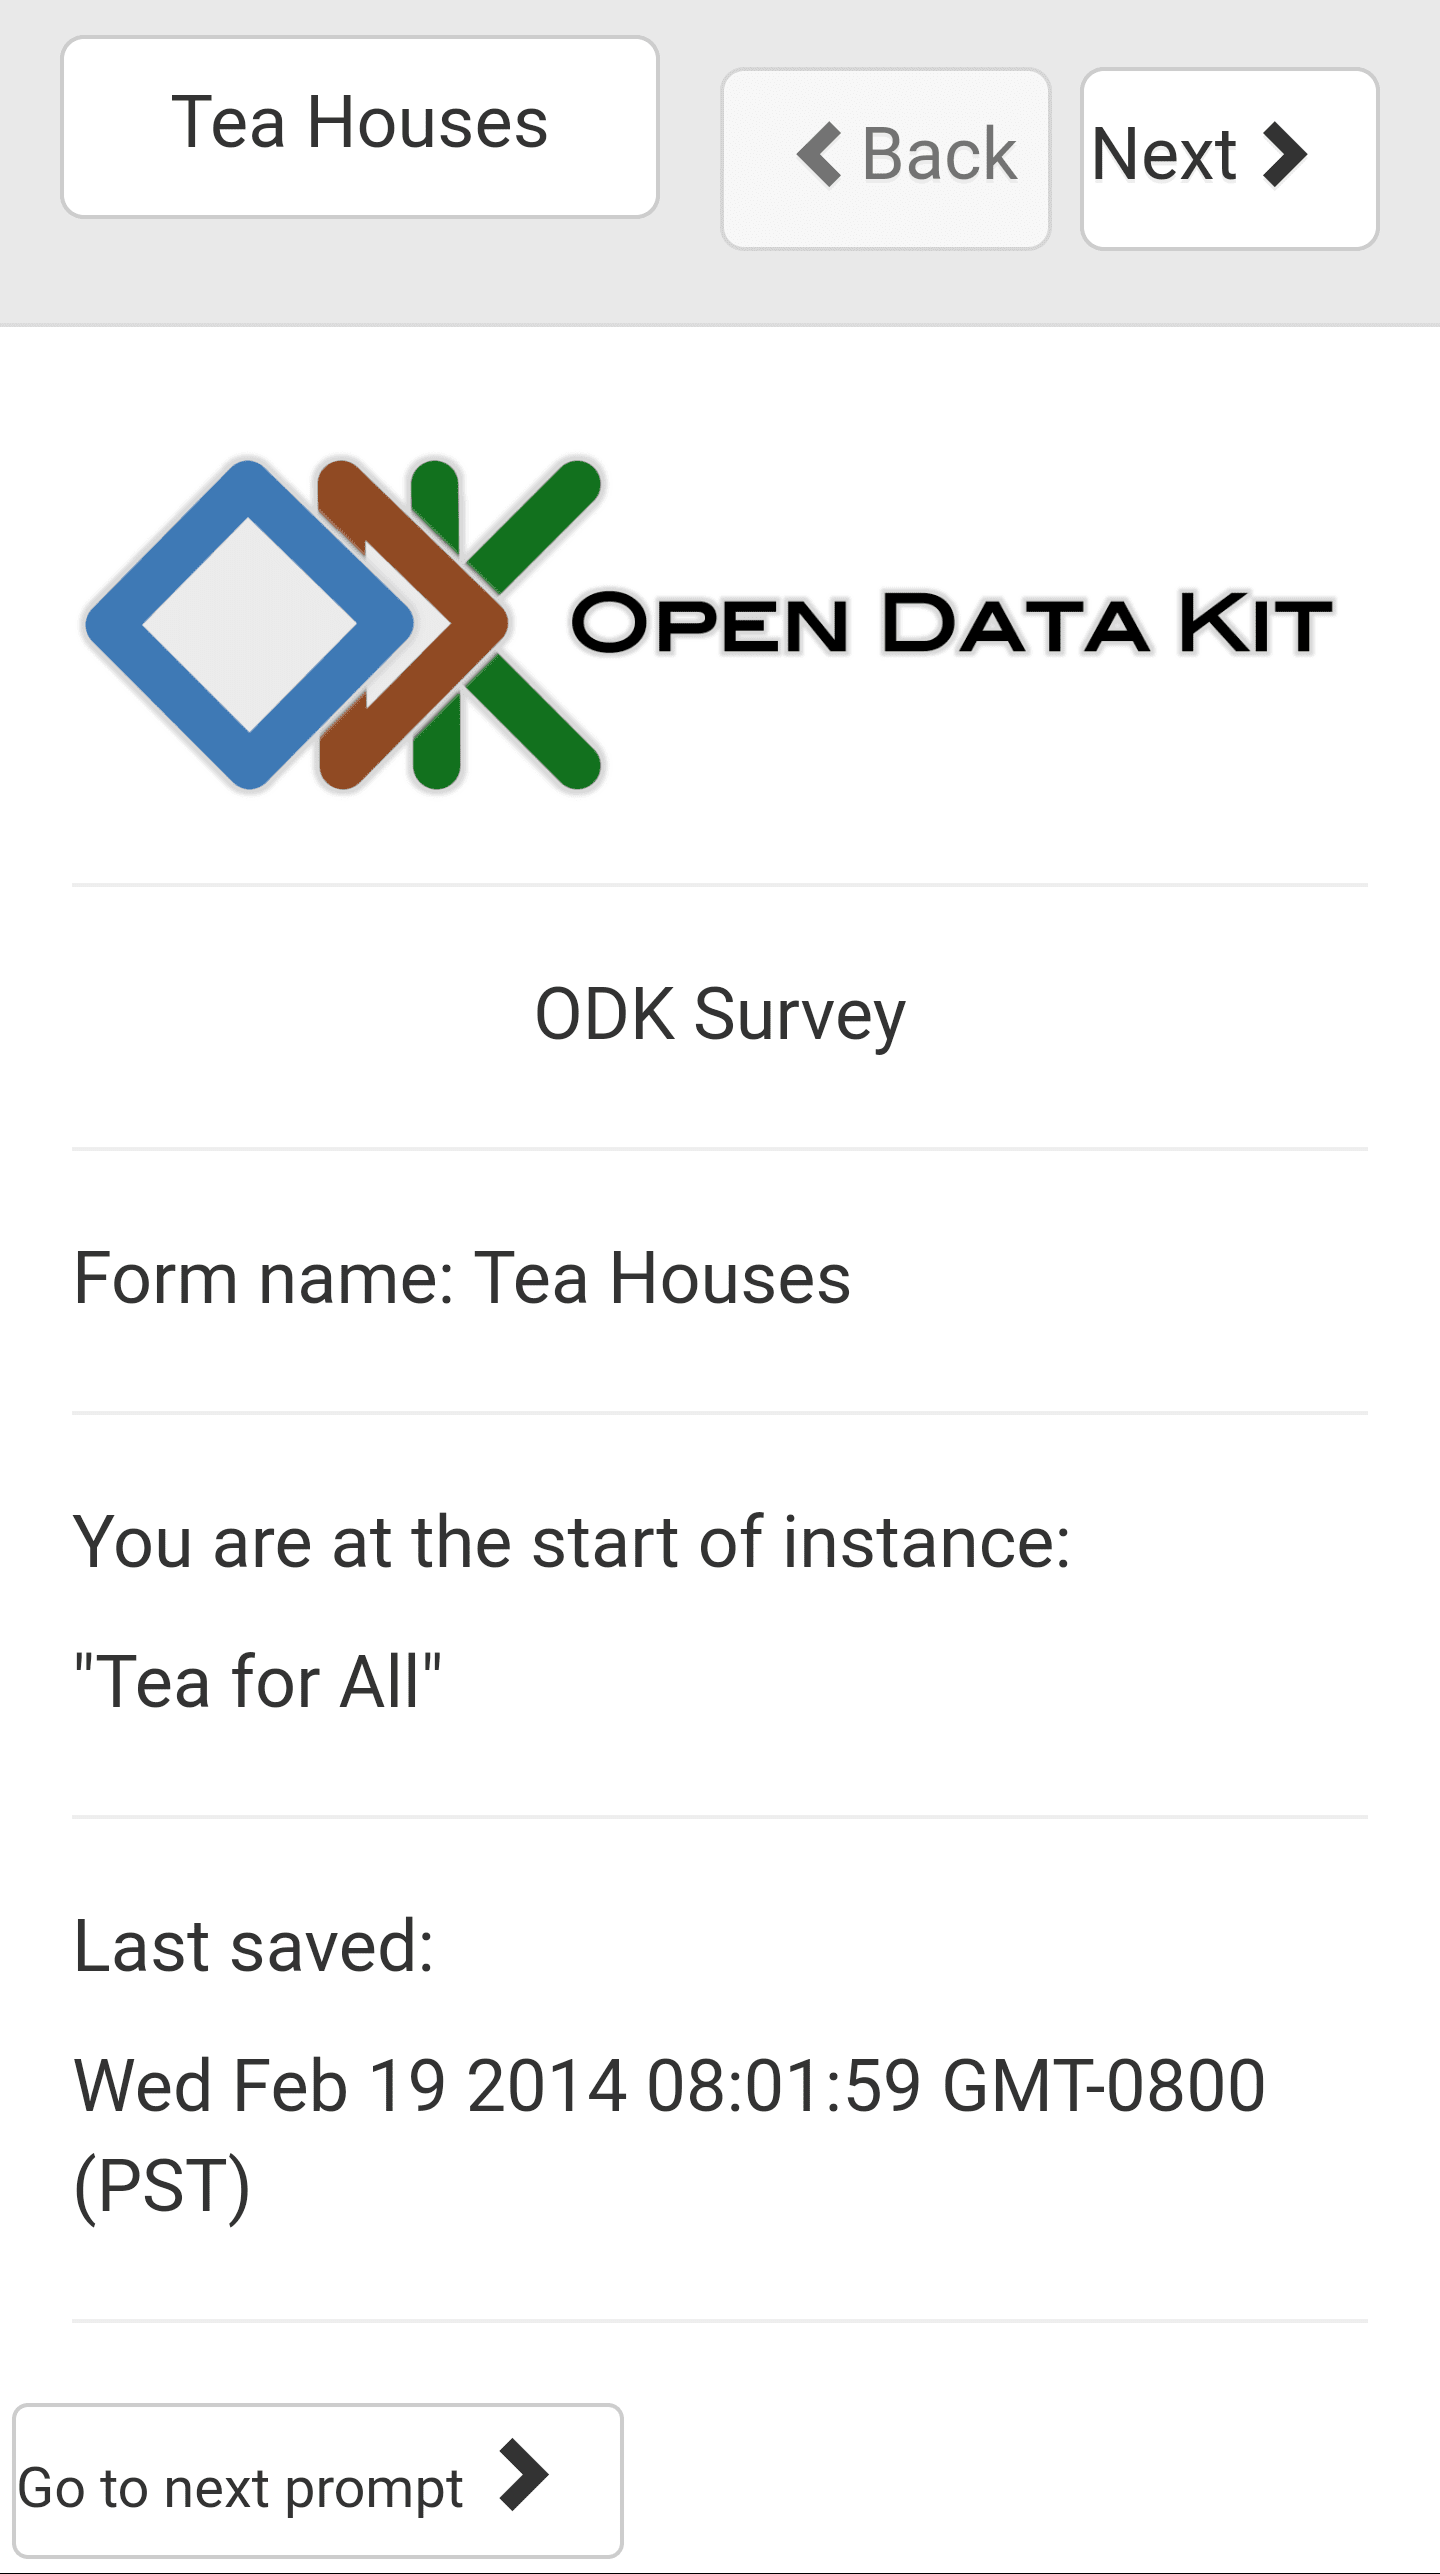
This will launch Survey to edit the Tea for All row in the Tea Houses data table.
This Survey form allows you to edit any and all of the data fields in the Tea for All entry. Navigate to the question that reads:
Which tea is the house specialty

Change the specialty to be Herbal. Complete the form and finalize the changes. When you return to the Tea for All detail page you will see the house specialty has been updated to Herbal.
Similarly, this action can be taken from a List View by using the + button in the upper right.
Tables and Survey are built to integrate seamlessly. Data can be visualized in Tables and edited in Survey, with your organizations complex workflow moving between as needed. A more complex example of this will be shown later in this tutorial with the Hope Demo.
Note
Survey is often the easiest way to edit data. However, Tables offers JavaScript APIs to directly edit data through your own custom user interfaces.
This concludes the Tea Houses demo. Next we will open the Geotagger Demo.
Learn More
For more information about launching Survey from Tables, view the Editing With Survey guide.
