JGI Demo
For this portion of the tutorial, we will explore the JGI demo. Select the tab labeled JGI and press Launch Demo.
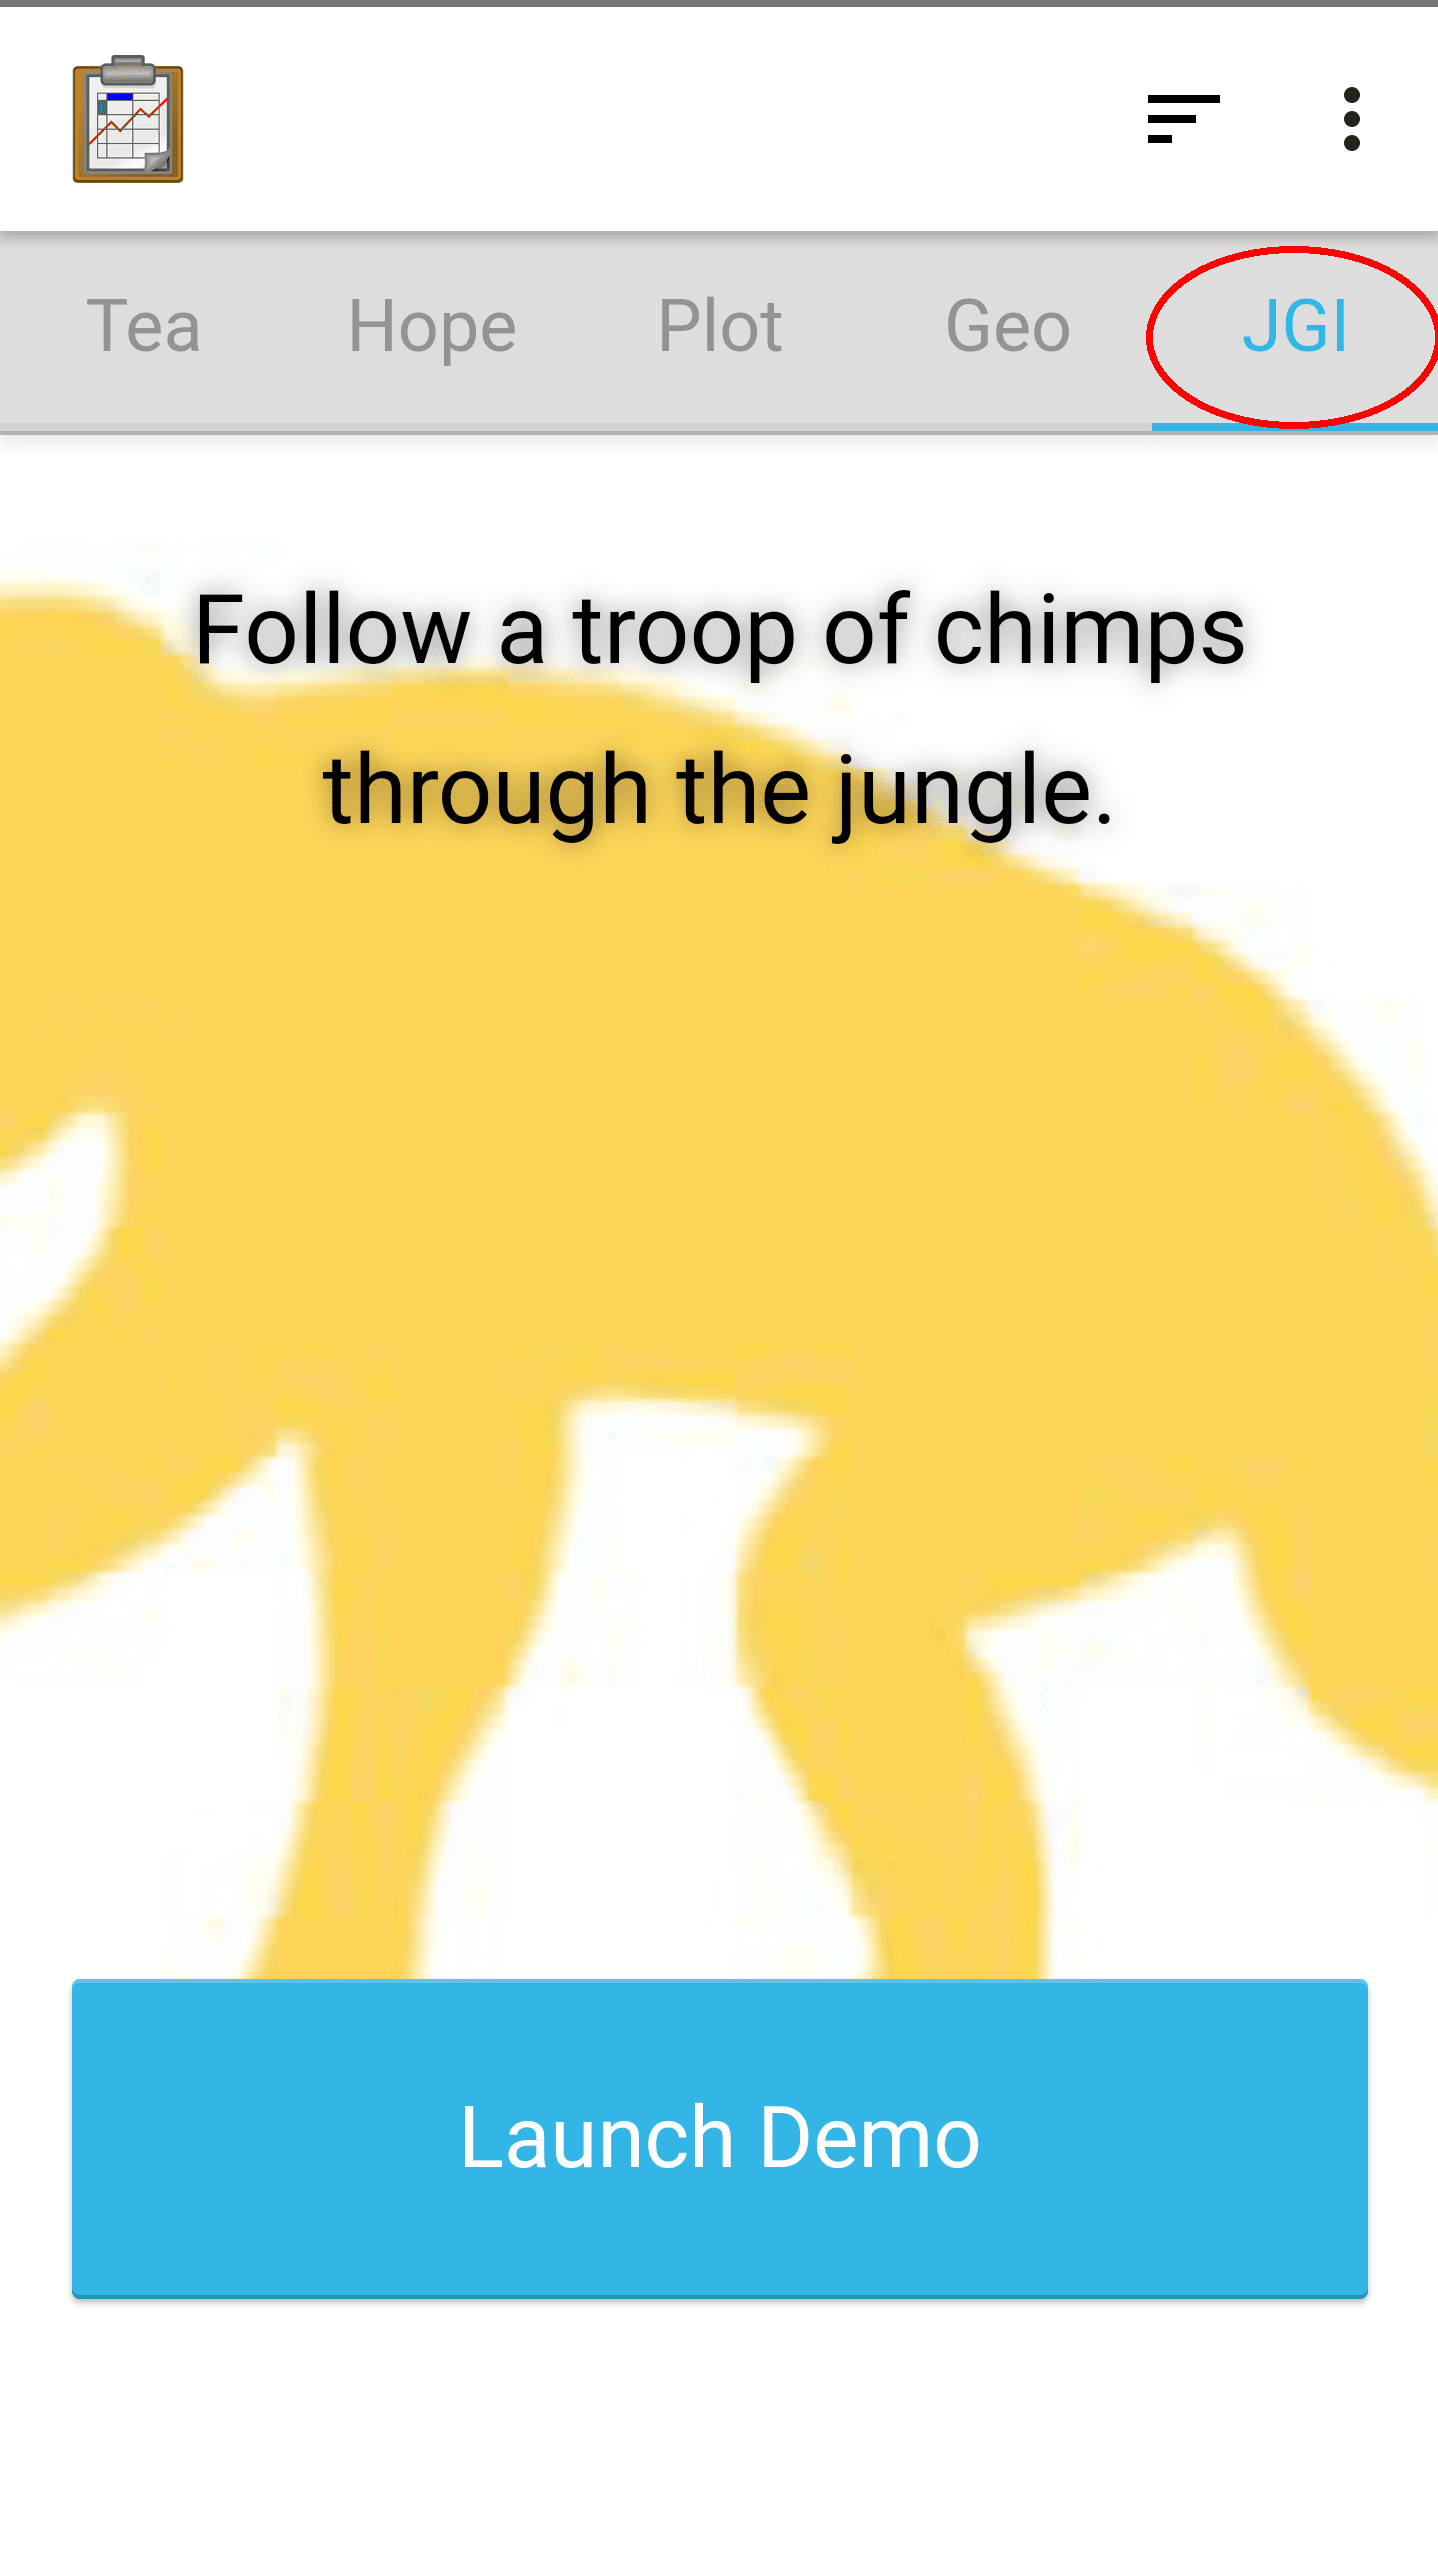
The JGI demo is a prototype of an application used by the Jane Goodall Institute to collect information about Chimpanzee behavior in the field.
Non-Form-Based Data Collection
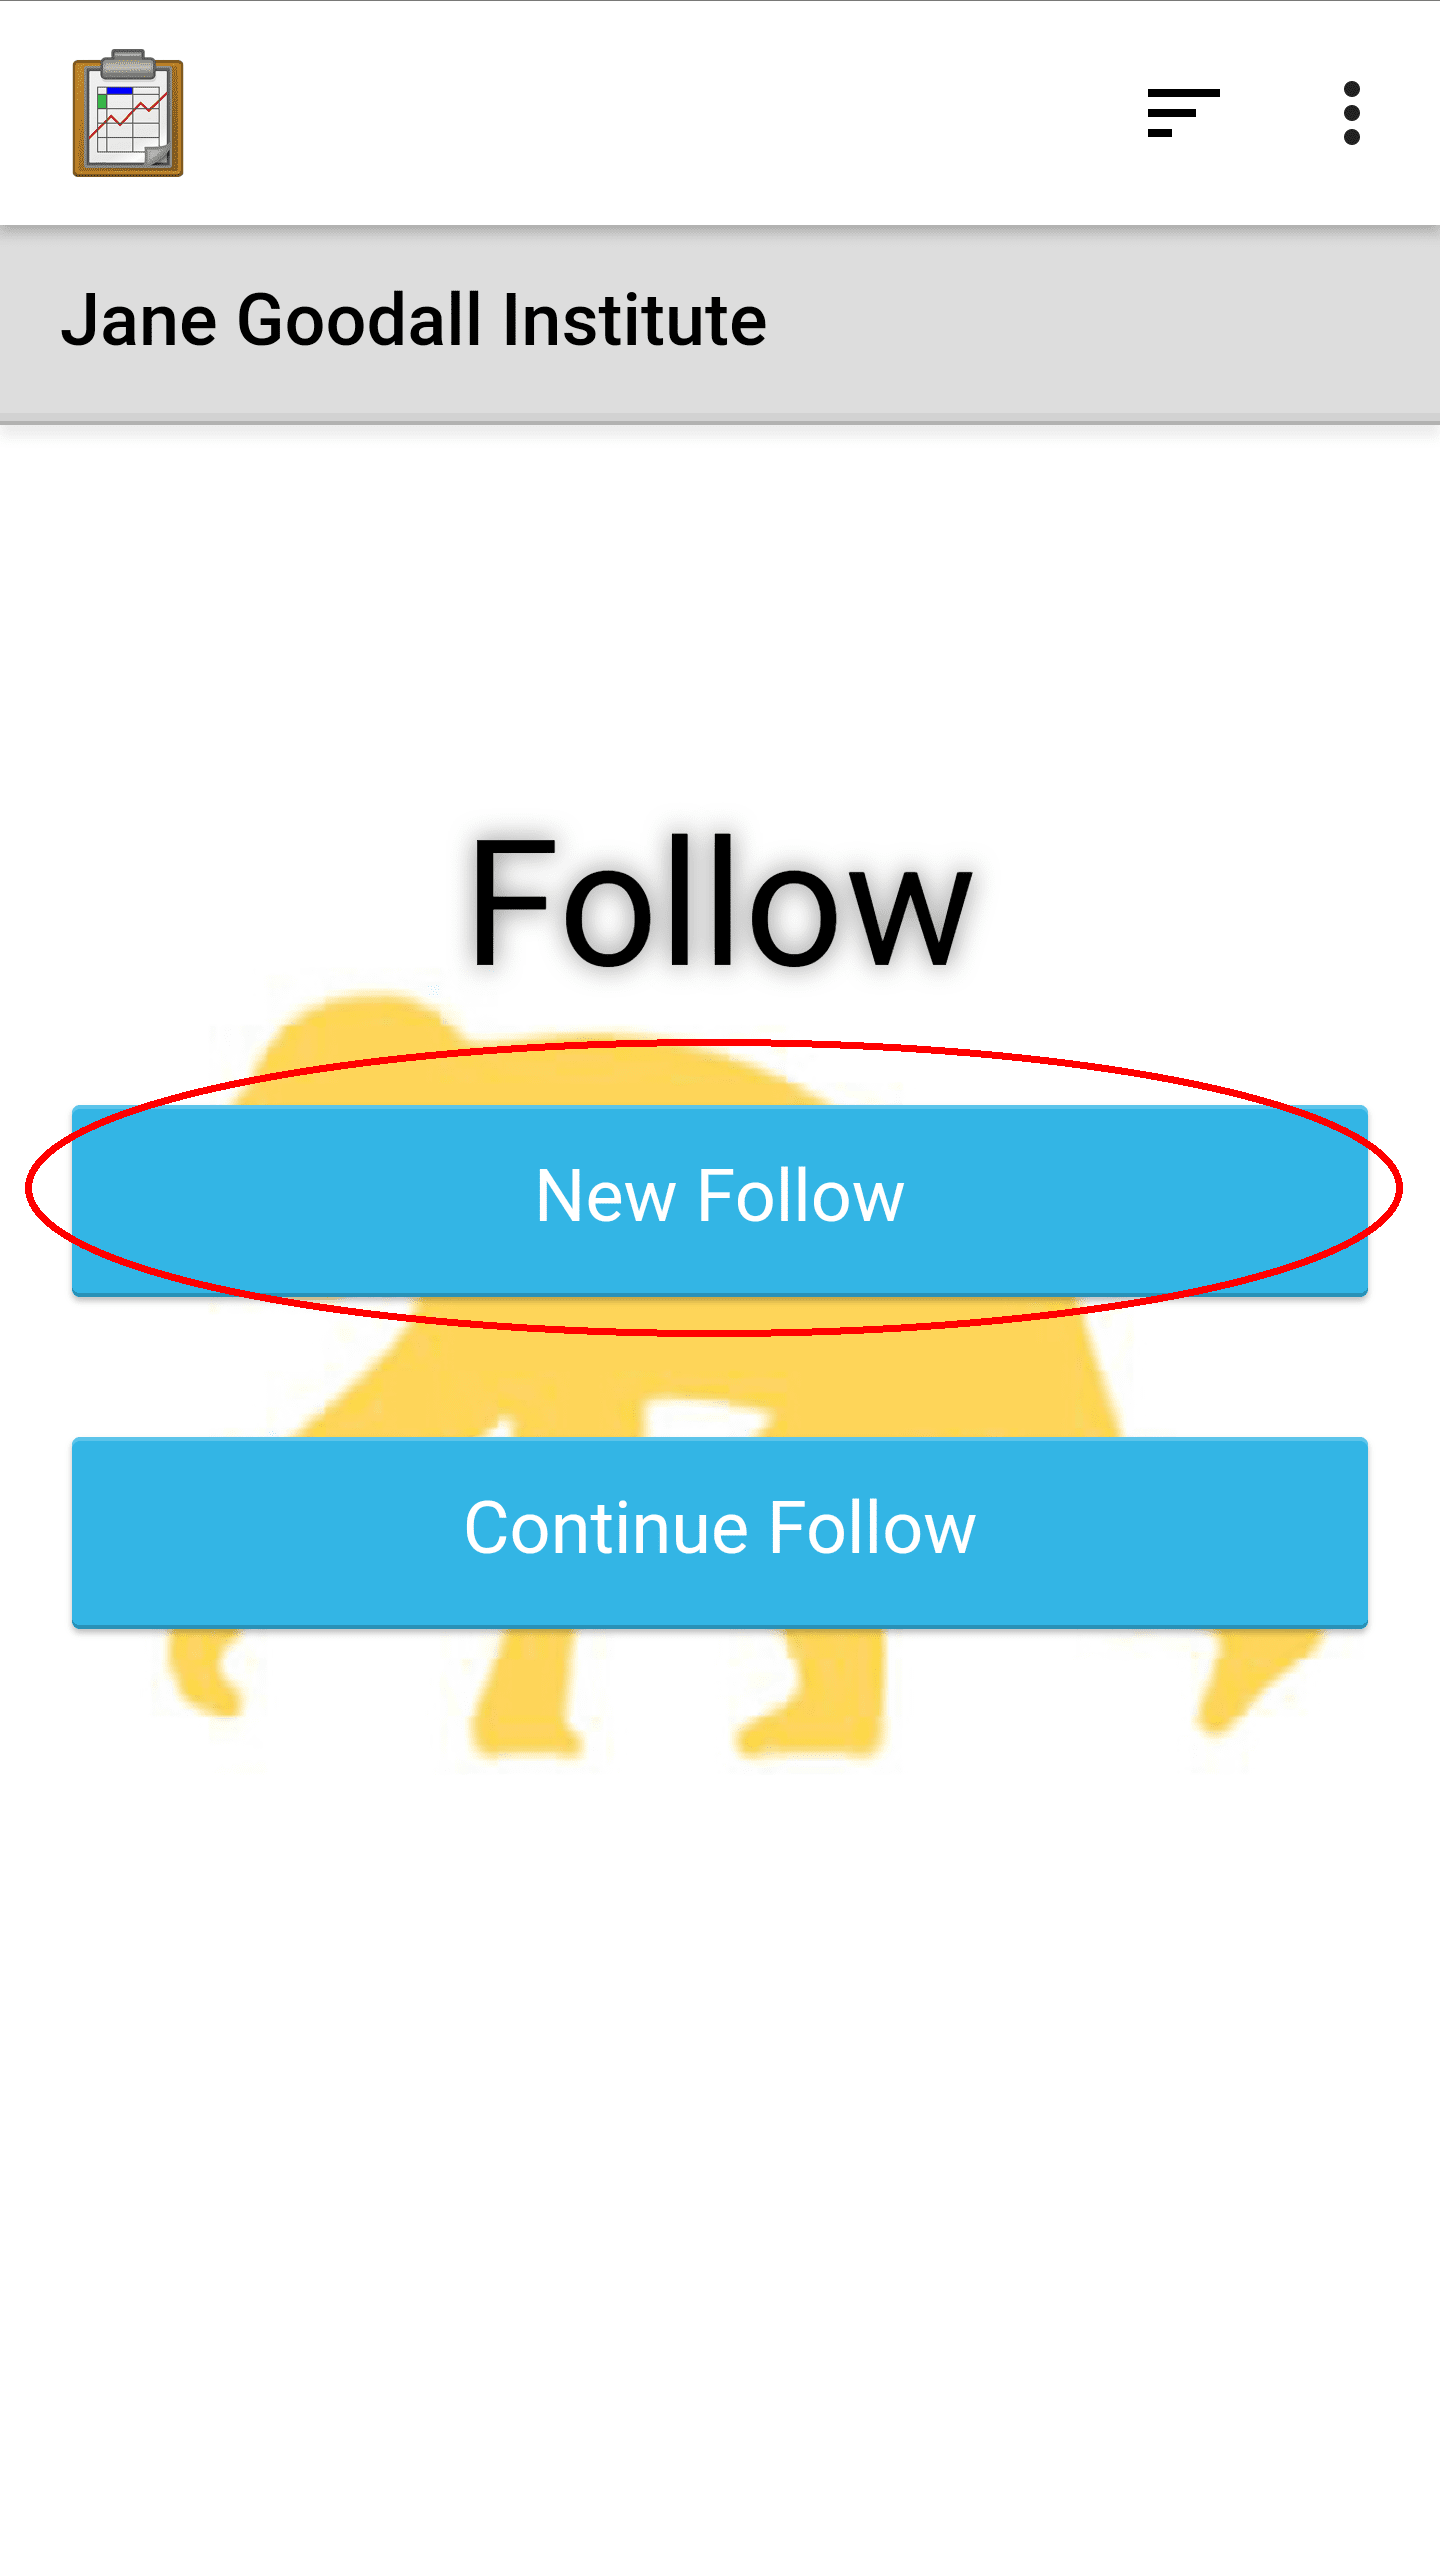
After launching the JGI demo app, you will see a custom view where you can choose to continue or start a new Follow. Choose New Follow.
The next screen will prompt you to enter data about the Follow you are about to perform.
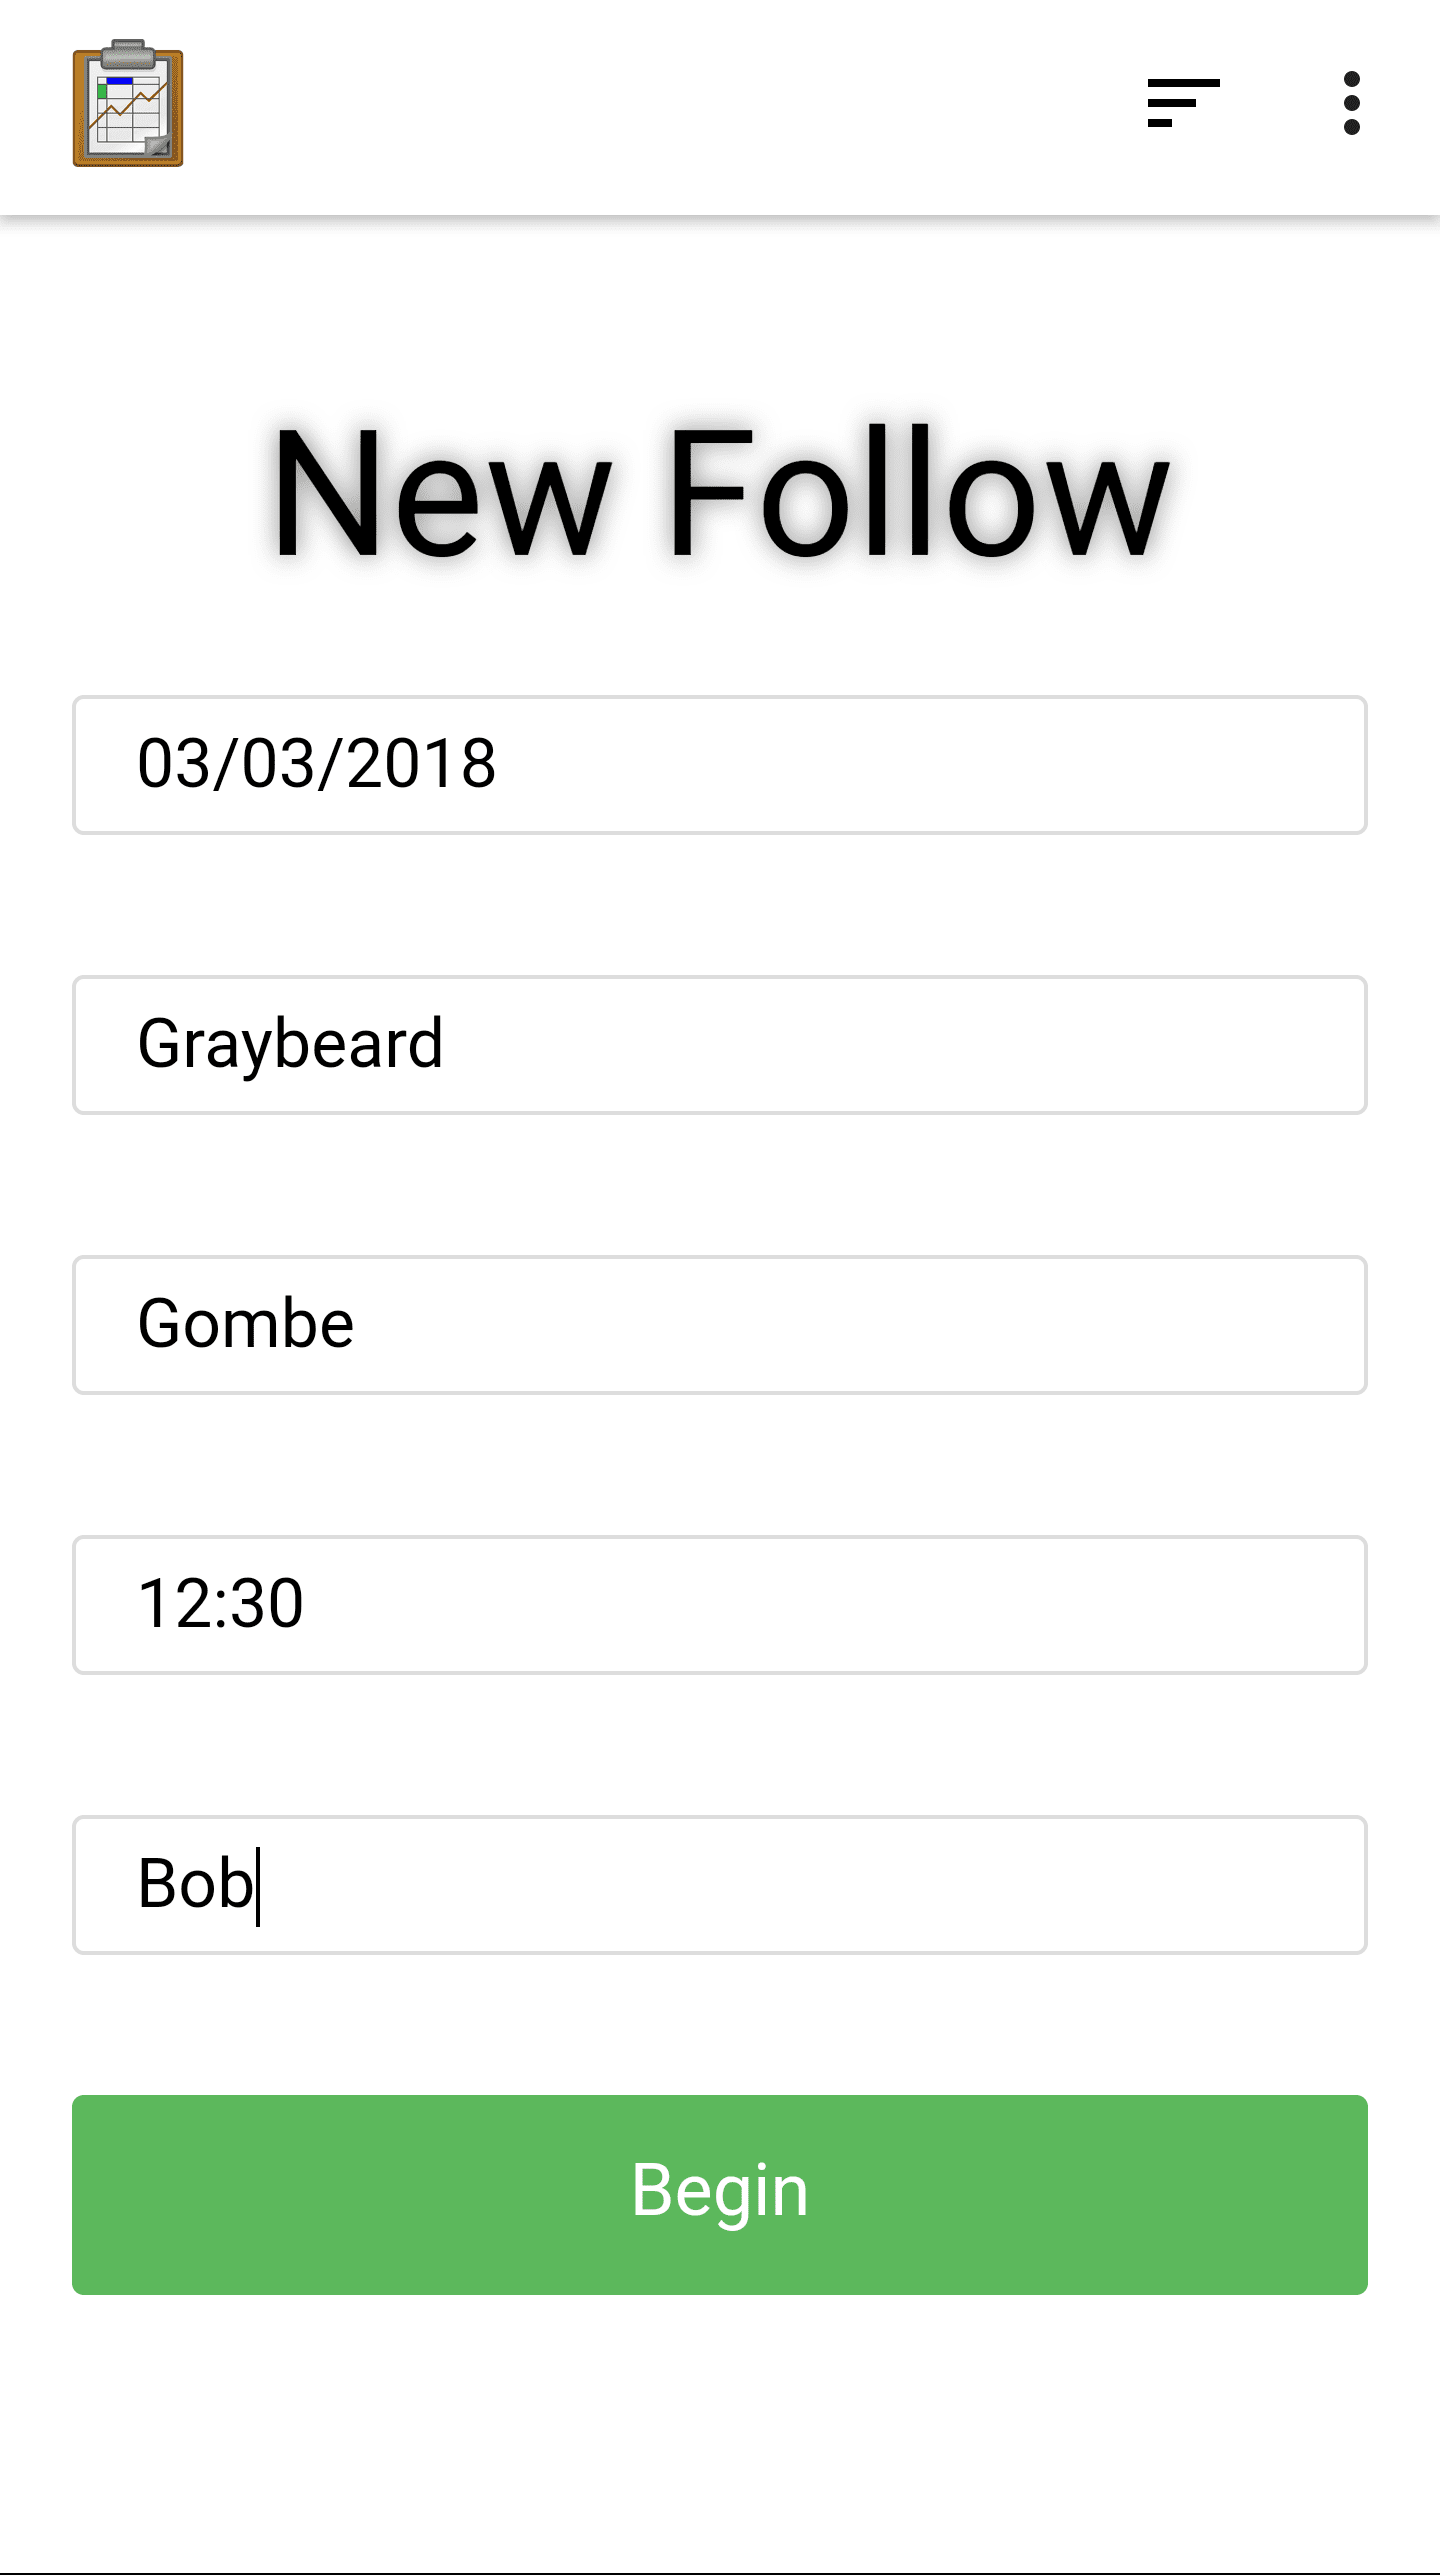
Note that we haven't launched Survey, this data is being collected by custom fields written in HTML, CSS, and JavaScript and rendered directly in the Tables view. Additionally, this data is not being used to create a single row in a single data table, it is going to be used by the following screen's JavaScript code to write to multiple rows in multiple data tables.
When you have filled in these data fields, press Begin. This will show start the Follow workflow.
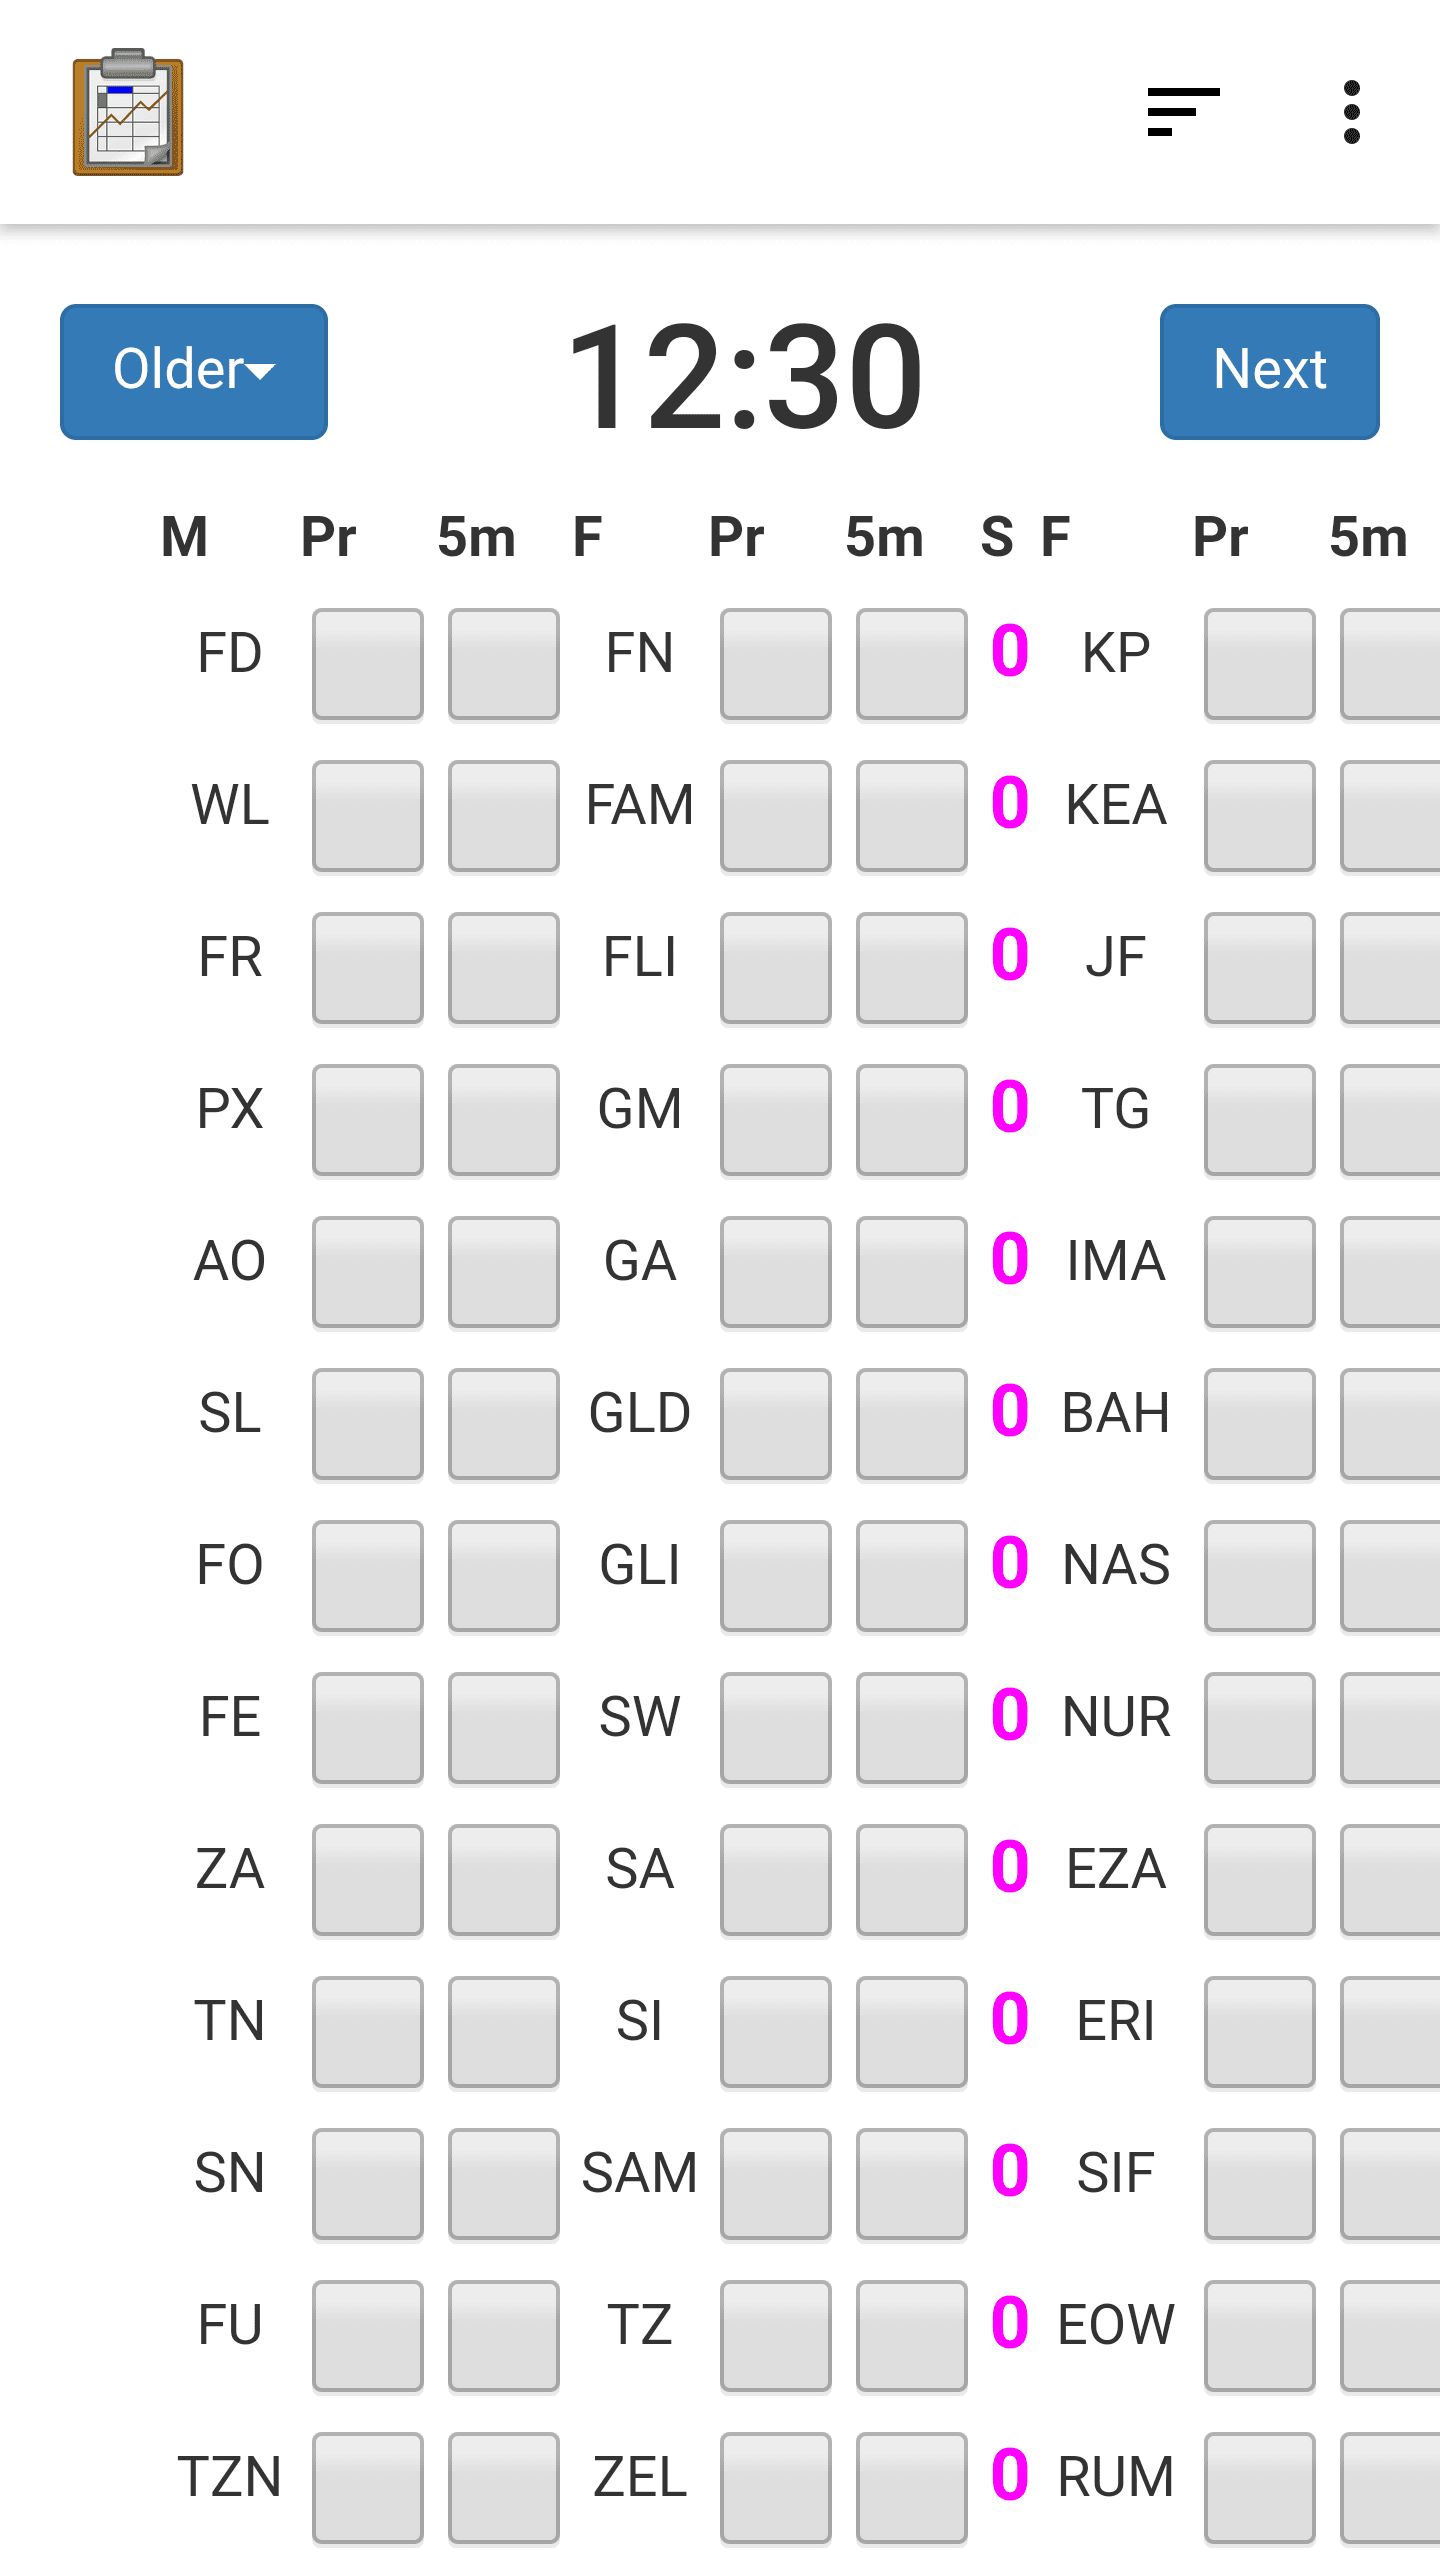
This screen is hard for a new user to understand. It is highly customized to the specifications of the Jane Goodall Institute's workflow. They originally used large paper notebooks with grids. They would check boxes on the grid based on observed chimpanzee behavior according to their own data collection protocols. This screen renders that same grid digitally and gives a worker access to dozens of fields simultaneously. Survey, Collect, or other form-based data entry models would be too scripted and confining for this type of dynamic interaction record. Furthermore, this screen will advance to a new data point every 15 minutes. This is another workflow necessity that is only possible because of customized JavaScript.
Finally, launch the Hope Demo.
Learn More
For more information about customized forms of data entry, view the Editing Directly in Tables: Custom Views guide.